The Canada Mortgage and Housing Corporation (CMHC) unveiled the results of its fifth cycle of the Social and Affordable Housing Survey – Rental Structures (SAHS‑RS), revealing key trends in Canada’s non‑market rental housing sector on July 22, 2025.
Coverage and Response
The survey covers nearly 593,000 units across Canada, with the highest share located in Ontario (56.1%), followed by British Columbia (11.5%), Quebec (9.4%), Alberta (6.7%), and other provinces and territories. Almost 60% of these units are concentrated in eight major Census Metropolitan Areas, including Toronto (30%), Vancouver (6%), Montréal (5.3%), Edmonton, Winnipeg, Calgary, Windsor, Victoria, Kitchener–Waterloo, and St. Catharines–Niagara .
Response rates inched up from 66% to 76% nationally, as CMHC expanded administrative data coverage and refined its sampling—though Quebec remains partially excluded due to missing data from structures managed by the Société d'habitation du Québec (SHQ).
Management and Funding of Units
The survey breaks down unit management as follows:
53% government-run (federal, provincial, municipal)
26% non‑profit organizations
7% cooperatives
17% private entities or joint partnerships
This reflects a longstanding dominance of government and non‑profit providers in Canada’s social housing landscape.
In terms of funding sources:
Federal government: 17%
Provincial/Territorial: 23%
Municipal: 30%
Other organizations or mixed sources: 11%
No formal funding agreement: 19%—this was particularly acute in the Northwest Territories (no agreements), contrasting with only 1% in New Brunswick and 5% in Quebec lacking agreements.
For operational deficit funding:
Federal: 1.5%
Provincial/Territorial: 24%
Municipal: 32.4%
Other or mixed: 5.6%
No coverage: 36.5%—varied by region. For example, 95% of Saskatchewan’s units lacked operational deficit funding, compared to just 5% in Manitoba.

Demographics and Tenant Groups
CMHC asked providers what populations they were mandated to serve:
Seniors: 33%
Families with children: 25%
Single men or women: ~11% each
Persons with physical or mental disabilities: ~4% each
Single-person tenants were less common in Saskatchewan and Alberta (1–5%), but represented 15–25% of the clientele in other provinces.
In terms of service providers:
56% of clientele served by government bodies
29% served by non‑profits
Services for veterans, persons with disabilities, First Nations, Métis, Inuit, immigrants, refugees, victims of domestic violence, and formerly homeless individuals were twice as likely to be provided by non‑profits compared with governments.
Age and Condition of the Housing Stock
The sector’s housing stock is aging:
15% built after 1995
35% built between 1980 and 1995
49% built before 1980
In Quebec and the three territories, over one‑third of units were built post‑2003. In contrast, Ontario, the Prairies and Atlantic provinces have 65–90% of stock built before 1987.
Regarding building condition:
43.5% of units rated as excellent/good
19% rated average
37.3% rated fair or poor — a pattern largely consistent with the 2023 survey, except Saskatchewan saw a sharp shift from average to fair condition (increasing fair-rated units from ~31% to ~79%).
Newer buildings fare better: 77% of units built after 2003 were in excellent or good condition, compared to 38% of older units (pre-2003) receiving that rating.
Why It Matters
These results show a non‑market housing sector that is heavily government-supported but aging, with significant regional disparities, especially in funding coverage and building condition. The rising number of units in fair or poor condition—particularly among older stock—highlights the critical need for renovation and investment. The unequal distribution of operational deficit funding and the significant share of units serving marginalized populations underscore ongoing equity challenges for social housing policy in Canada.
(How much is your home worth? Contact us for a Free Home Evaluation.)


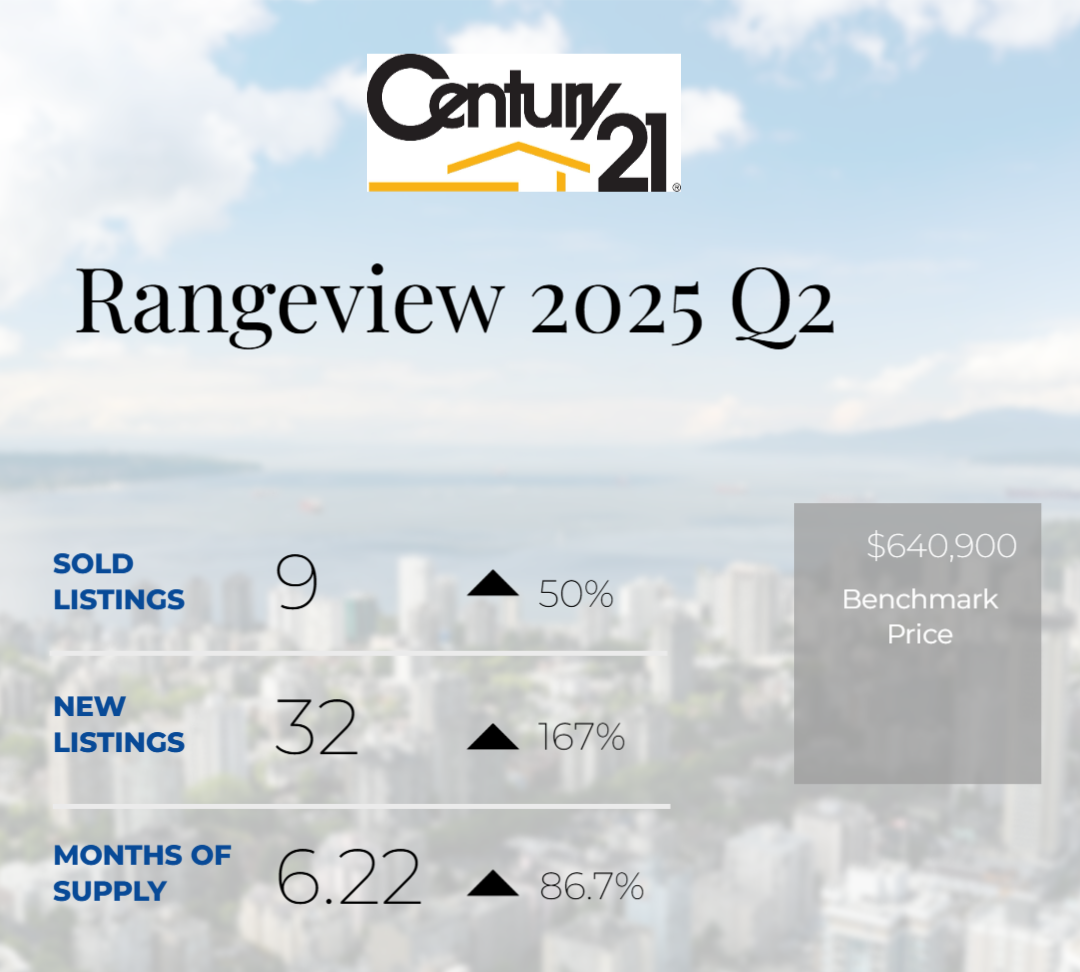
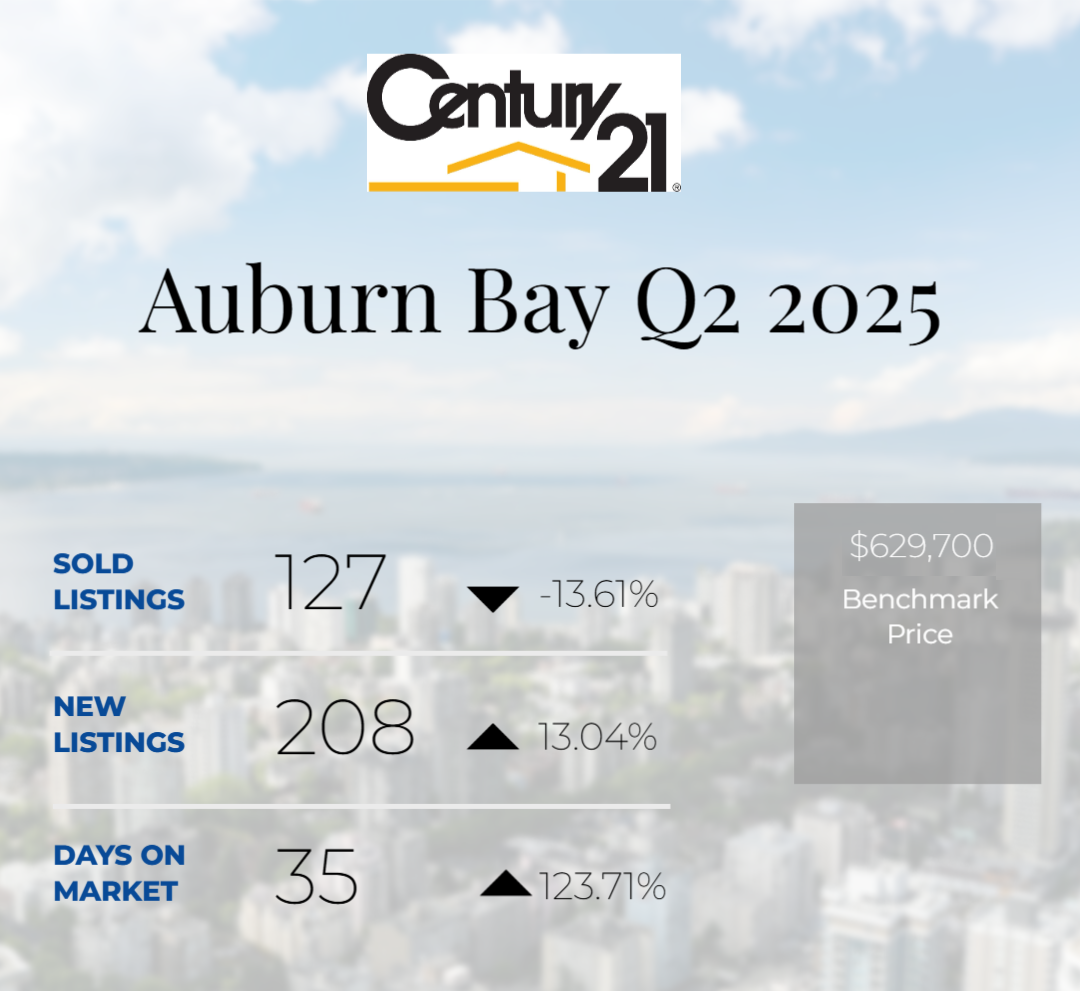
 独立屋市场亮点分析
 趋势判断
趋势判断