Market Overview
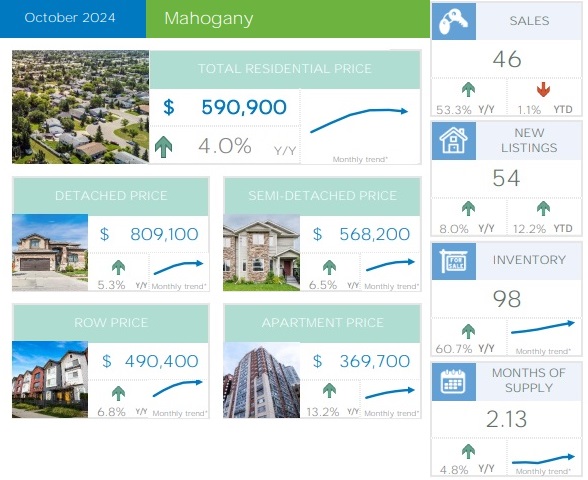
In October 2024, the Mahogany SE Calgary real estate market experienced notable activity, with increases in sales across property types. Total residential sales for the month reached 46 houses, representing a 53% year-over-year increase. New listings were also up, reaching 54, an 8% increase year-over-year. Inventory saw a more significant rise, growing by 61% to 98 units. The sales-to-new-listings (S/NL) ratio stood at 85%, indicating a competitive market despite the growing inventory levels. The months of supply metric rose to 2.13, reflecting a balanced market yet trending toward a potential buyer's market if inventory growth continues.
The benchmark price for all residential properties in Mahogany rose by 4% year-over-year to $590,900.
Detached Homes
Sales: 22 (up 57% year-over-year)
New Listings: 29 (up 7% year-over-year)
Inventory: 37 (up 9% year-over-year)
Months of Supply: 1.68 (down 31% year-over-year)
Benchmark Price: $809,100 (up 5% year-over-year)
Detached homes remained popular, with a 57% increase in sales and a tight supply of only 1.68 months, marking a slight seller's advantage in this category. The benchmark price rose 5% to $809,100, indicating steady demand for single-family homes in Mahogany.
Semi-Detached Homes
Sales: 8 (up 300% year-over-year)
New Listings: 7 (up 40% year-over-year)
Inventory: 8 (no change year-over-year)
Months of Supply: 1.00 (down 75% year-over-year)
Benchmark Price: $568,200 (up 7% year-over-year)
Semi-detached homes saw the highest increase in sales at 300%, with a balanced supply level of 1.00 month. This segment is seeing strong buyer interest, as evidenced by the quick sales pace and a 7% increase in the benchmark price to $568,200.
Row Homes
Sales: 4 (up 33% year-over-year)
New Listings: 2 (down 50% year-over-year)
Inventory: 20 (up 567% year-over-year)
Months of Supply: 5.00 (up 400% year-over-year)
Benchmark Price: $490,400 (up 7% year-over-year)
Row homes showed a mixed performance. Sales increased by 33%, but new listings dropped by 50%, leading to a spike in inventory, which now sits at 20 units, a 567% year-over-year increase. With a months of supply at 5.00, row homes are transitioning into a buyer’s market, despite a 7% increase in the benchmark price.
Apartments
Sales: 12 (up 9% year-over-year)
New Listings: 16 (up 14% year-over-year)
Inventory: 33 (up 106% year-over-year)
Months of Supply: 2.75 (up 89% year-over-year)
Benchmark Price: $369,700 (up 13% year-over-year)
The apartment market has become more competitive, with inventory rising 106% to 33 units and the months of supply increasing to 2.75. Sales were up 9%, and the benchmark price rose 13% to $369,700, indicating resilient demand despite the increased supply.
Price Range Distribution
The distribution of sales by price range showed a concentration in the $400,000–$499,999 range, followed by a significant number of transactions in the $200,000–$300,000 and $300,000–$400,000 ranges. Higher price brackets, particularly above $700,000, also saw activity but to a lesser extent.
Year-to-Date Overview
As of October 2024, year-to-date sales totaled 373, reflecting a slight 1% decrease from the previous year. New listings year-to-date reached 550 (up 12%), while inventory rose to 76 units (up 29%). The year-to-date benchmark price increased by 7% to $595,180, underscoring steady appreciation in Mahogany’s residential market despite slight reductions in sales volume.
Conclusion
Overall, Mahogany’s real estate market in October 2024 demonstrates robust demand and rising prices across most property types, with particular strength in detached and semi-detached homes. While inventory levels are increasing, especially in row homes and apartments, the area’s popularity supports ongoing price growth.

Comments:
Post Your Comment: