RSS

Calgary Auburn Bay Real Estate Market — December 2025

December wrapped up with 20 sales in Auburn Bay — an 11.1% increase year-over-year, though year-to-date totals remain 16.6% lower than 2024 as sales softened through fall. Inventory rose to 44 units (+57.1% Y/Y), pushing months of supply to 2.20, shifting conditions toward balance. 14 new listings entered the market (-12.5% Y/Y), helping slow further inventory buildup.

Prices continued to adjust from peak levels. The residential benchmark price moved to $602,100 (-5.6% Y/Y), with all property types trending downward on both annual and short-term measures:

  • Detached: $756,600 (-4.7% Y/Y)

  • Semi-Detached: $511,500 (-4.7% Y/Y)

  • Row: $434,900 (-5.8% Y/Y)

  • Apartment: $329,200 (-8.8% Y/Y)

The six-month trend signals continued mild downward pressure as the community transitions from the post-pandemic seller’s market to a more balanced environment heading into 2026.

Schools & Education

Auburn Bay offers a full school pipeline for local families, including:

  • Auburn Bay School (K–4)

  • Lakeshore School (5-9)

  • Prince of Peace School (K-9, Catholic)

  • Joane Cardinal-Schubert High School (in adjacent Seton)

The easing of enrollment pressures through 2025, combined with planned catchment adjustments in surrounding communities, continues to stabilize demand for family housing.


Local Development & News

The broader Seton/Auburn Bay corridor remains one of Calgary’s highest-growth districts. Notable updates include:

  • Continued retail expansion in Seton Market and Auburn Station

  • Improved pedestrian integration between the lake community and the South Health Campus

  • Ongoing housing diversification, with more row and apartment product supporting affordability

  • Continued discussion around future transit connectivity and cycling infrastructure

These additions support value long-term even as pricing recalibrates in the near term.


With balanced supply, stabilizing demand, and more diverse product types coming to market, Auburn Bay is positioned for a measured and sustainable 2026. Buyers gain negotiating power and choice, while sellers benefit from strong community fundamentals, amenities, and lifestyle advantages that continue to draw families into the southeast.

FREE Home Evaluation here.

Read

Calgary Latest Real Estate Market update - Dec. 2025

Following several years of strong price growth, 2025 marked a year of transition thanks to strong demand and limited supply. Due to record high starts, supply levels improved across all aspects of the housing market, just as demand pressure eased due to a reduction in migration levels and heightened uncertainty that persisted throughout the spring market. This helped shift the resale market from one that favoured the seller to one that was more balanced. 

In 2025, sales reached 22,751 units, down 16 per cent over last year, but in-line with long-term trends. Much of the shift came from the growth in supply. 2025 saw over 40,000 new listings come onto the market, nine per cent higher than last year, causing inventories to rise and driving more balanced conditions. 

“Supply levels were expected to rise in 2025. However, the growth was higher than expected especially for apartment condominium and row homes. This weighed on prices in those sectors enough to offset the annual gains reported for both detached and semi-detached homes,” said Ann-Marie Lurie, CREB®’s Chief Economist. "Adjustments in both supply and demand varied across the city, with pockets of the market continuing to experience seller’s market conditions versus some areas where the conditions favoured the buyer. This resulted in different price trends based on location, price range and property type.” 

Overall, the annual average total residential benchmark price in 2025 was $577,492, two per cent lower than last year’s annual average. However, annual detached and semi-detached prices rose by a respective one and three per cent, while apartment and row homes saw prices fall by a respective three and two per cent. 

Compared to other districts, the North East reported the largest decline in prices this year. While some of this is related to improved supply across all areas of the city, it is also important to note that the North East district also reported the strongest price growth over the past two years. 

Detached

Detached sales totaled 11,328 in 2025, down by nearly nine per cent compared to last year. Sales eased across all districts in the city, with the steepest declines occurring in the North East, East and City Centre district. However, unlike the City Centre, the North East and East districts also experienced significant gains in inventory compared to long-term trends, driving annual price declines of two per cent. Meanwhile, in the City Centre detached inventory remained well below long-term averages, which likely prevented stronger sales and contributed to the annual price growth of over three per cent. Despite the differing conditions in different areas of the city, slowing sales and rising supply citywide helped move the market into balanced conditions by the second half of the year. The annual average benchmark price was $752,767, one per cent higher than last year’s annual level.  

Semi-Detached

Semi-detached homes represent the smallest segment of the market, accounting for less than 10 per cent of all sales activity. Sales in 2025 were 2,159, eight per cent lower than last year, but slightly higher than long-term trends. Trends for semi-detached homes have been relatively consistent with the detached market. However, it took longer for this segment of the market to shift to more balanced conditions, resulting in stronger annual price gains. In 2025, the average annual benchmark price was $685,850, nearly three per cent higher than last year. Prices did ease in the North district as competition for new homes weighed on resale activity, but the decline in this district was more than offset by the four per cent gain in the City Centre. 

Row

2025 sales eased by 17 per cent to 3,838 units. Despite the decline, sales were still higher than long-term trends, as row homes are starting to account for a larger share of the overall activity in the city. At the same time, new listings also rose relative to sales, driving inventory gains and taking the pressure off prices. Conditions shifted to more balanced levels relatively early in the year, and by the last quarter conditions ranged from a balanced to a buyer’s market depending on the districts of the city. Overall, this contributed to the annual average benchmark price decline of two per cent. While prices were relatively stable in the City Centre, North West, West  and East districts, additional supply in the resale market and competition from new homes caused prices to decline by four per cent in the North East and North districts.

Apartment Condominium

Apartment-style homes reported the largest adjustment in price in 2025. Sales declined by 28 per cent compared to the near record high levels achieved last year. While the decline was significant, sales were still over 28 per cent higher than long-term trends. The main cause of the shift in conditions was due to the supply. Over the past three years, there has been a rise in apartment-style starts. While most of the apartment starts were purpose-built rental, they are adding to the supply choice and weighing on the resale market. Resale condominiums saw the market shift in favour of buyers by the second half of the year, with elevated months of supply being reported in most districts of the city. This resulted in relatively persistent downward pressure on prices, causing the annual average benchmark price to decline by nearly three per cent. Price declines were the steepest in the North East nearing five per cent. The only area to report relative stability in the annual price was in the West district.

Read

NOV 2025 - Calgary Latest Real Estate Market Report

In line with typical seasonal trends, sales, new listings and inventory levels all slowed relative to last month. The 1,553 sales were met with 2,251 new listings, causing the sales-to-new-listings levels ratio to improve to 69 per cent. This also helped support some of the inventory adjustment. However, with 5,581 units in inventory, levels are still 28 per cent higher than last year and over 15 per cent higher than typical levels reported in November. 

“Supply levels have been sitting higher than typical levels for the past three months, mostly due to the gains occurring in the higher-density sectors of row and apartment style units,” said Ann-Marie Lurie, CREB®’s Chief Economist. “This is partially related to the additional supply choice coming from the new homes sector, some of which end up on the resale market, especially near the end of the year. While buyer’s market conditions are more prevalent for apartment-style homes and to a lesser extent row homes, outside of a few pockets of the market, both the detached and semi-detached markets are relatively balanced.”   

The additional supply choice across resale, new and rental markets, is having the most impact on apartment and row style home prices which are reporting year-over-year price declines of seven and six per cent. In comparison detached home prices are down by two per cent compared to last November, but still higher than last year when looking at year-to-date figures. Overall, the unadjusted total combined residential benchmark* price in November was $559,000, nearly five per cent lower than last year. 

*To keep the benchmark price relevant, once a year the attributes of a benchmark home are reviewed and the benchmark prices are updated. The review has been completed and the data has been updated.  While all historical adjustments have occurred, old PDF monthly reports are not adjusted. 

Detached

Detached sales in November were 823 units, just slightly lower than last year’s level, and relatively consistent with activity reported for November. The monthly reduction in new listings helped push down inventory levels compared to last month, but inventory remained well above the lower levels reported last year and are now relatively consistent with long-term trends. Overall, the months of supply remained around three months, reflecting a relatively balanced condition. Despite this we did see unadjusted prices trend down over last month, mostly reflecting seasonal patterns. As of November, the unadjusted detached benchmark price was $733,000, down by nearly two per cent compared to last November. However, when considering the year-to-date figures, prices are still one per cent higher than last year. Most of the downward price adjustments have occurred in the North East, North and East districts as competition from new homes and additional supply choice in other parts of the city are more heavily weighing on those districts.   

Semi-Detached

Sales in November were comparable to levels reported last year and still well above long-term trends, but with new listings also higher than typical levels for this time of year, inventories rose to the highest November level seen over the past five years. While conditions have been generally tighter for this property type, over the past three months we have seen the months of supply remain above three months, resulting in more balanced conditions. While the unadjusted benchmark price of $671,700 did ease over last month, it remained stable compared to last year. Year-to-date price growth has been the strongest in this sector at nearly three per cent, with the largest gains occurring in the City Centre at four per cent, partially offsetting the one per cent pullback in the North district. 

Row

November sales eased to 257, however, last year was a record high for the month and current sales remain above long-term trends. Where there continues to be more notable shifts is in supply. New listings remained comparable to last year and inventories, while reporting the typical seasonal decline, were at November levels not seen since 2018. The additional supply has caused the months of supply to remain slightly elevated, especially over the past three months. This has been placing some downward pressure on prices. In November, the unadjusted benchmark price was $424,400, down over last month and over six per cent lower than last year. While some of the monthly decline is seasonal, more persistent price declines have caused the year-to-date price to fall by nearly two per cent. 

Apartment Condominium

This sector has struggled the most with excess supply. November sales dropped to levels consistent with long-term trends, but new listings remained elevated and November inventory levels hit a record high for the month. The months of supply edged near six months and has been sitting above four months since the summer. This has resulted in relatively persistent price adjustments throughout the second half of the year and as of November the unadjusted benchmark price was $309,300, seven per cent lower than last year at this time. Year-to-date the decline was just over two per cent, with the largest decline occurring in the North East district at nearly five per cent. The only district to see prices remain flat was the West district.

REGIONAL MARKET FACTS


Airdrie

As per typical seasonal behaviour, sales, new listings and inventory levels all eased over levels reported last month. Overall, both sales and new listings have remained at levels consistent with long-term trends for the month, but thanks to earlier gains inventory levels remain elevated for November. Some of the rise is due to a higher share of newer homes coming onto the resale market. The additional supply over the past several months has weighed on prices in Airdrie. While it has by no means offset the gains reported over the past four years, year-to-date benchmark prices for detached homes are down by nearly one per cent compared to last year. 

Cochrane

The seasonal monthly pullback in new listings was not enough to prevent November levels from reaching a record high. While sales also remained relatively strong for November, it was not high enough to cause a more significant monthly pullback in inventories, which have not been this high in November since 2018. Some of the gains in new listings were due to a larger share of new homes being listed on the resale market. While recent gains in supply have caused some adjustments in price, prices continue to remain higher than levels reported last year. Year-to-date detached benchmark prices are nearly two per cent higher than levels reported last year.

Okotoks

Unlike other areas, sales in Okotoks improved compared to last month and were similar to levels reported last year. This in part could be related to the higher level of new listings that were available both in November and October, providing more choice to potential buyers. The Okotoks market has seen some recent gains in inventory levels, but overall supply remains well below long-term trends. Conditions have remained relatively tight in the Okotoks market and, despite some recent adjustments in prices, overall prices are still higher than last year on a year-to-date basis across each property type.

Contact us for a Free Home Evaluation.

Read

Pace of new listings growth slows, preventing further inventory gains - Oct 2025

Inventory levels eased over last month thanks to the combined impact of a monthly pullback in new listings and a monthly pick up in sales. With 6,471 units in inventory and 1,885 sales the October months of supply returned to three-and-a-half months after pushing up to four months in September. While both row- and apartment-style properties continue to report elevated supply levels compared to demand, conditions remain relatively balanced for both detached and semi-detached properties. 

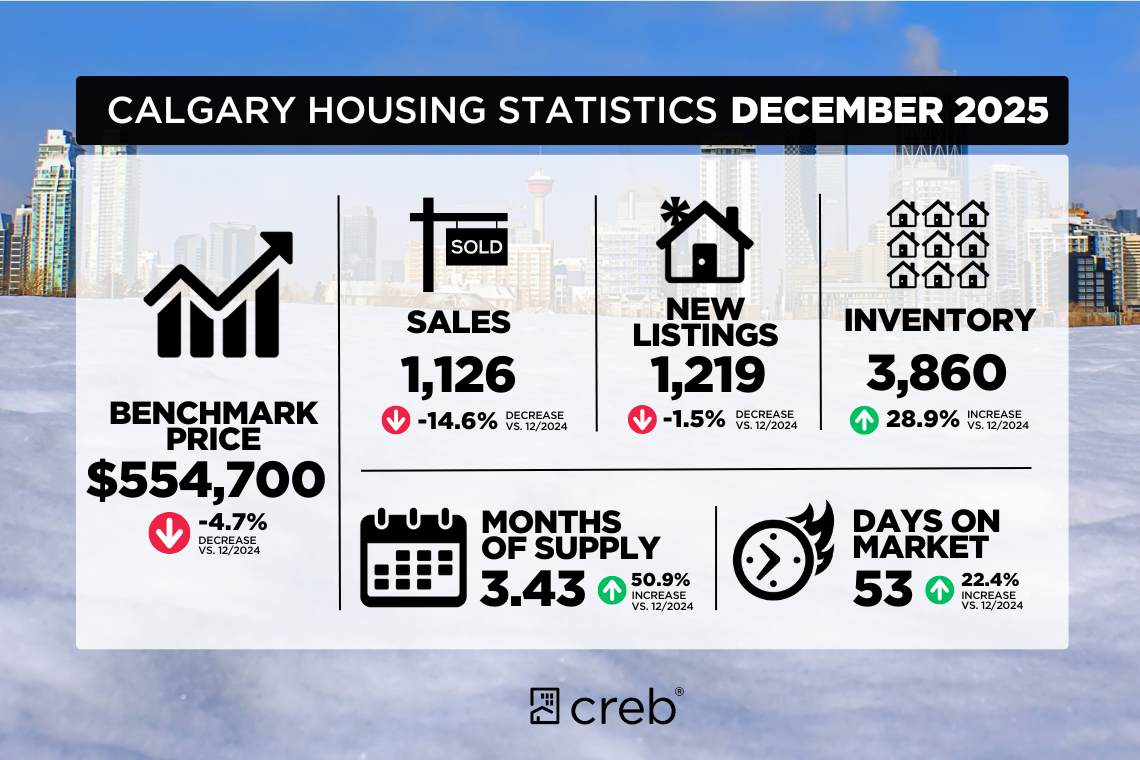
Year-to-date sales in the city totaled 20,082, down nearly 16 per cent compared to last year, but still in line with longer-term trends. Much of the decline in sales has been driven by pullbacks for apartment- and row-style homes.   

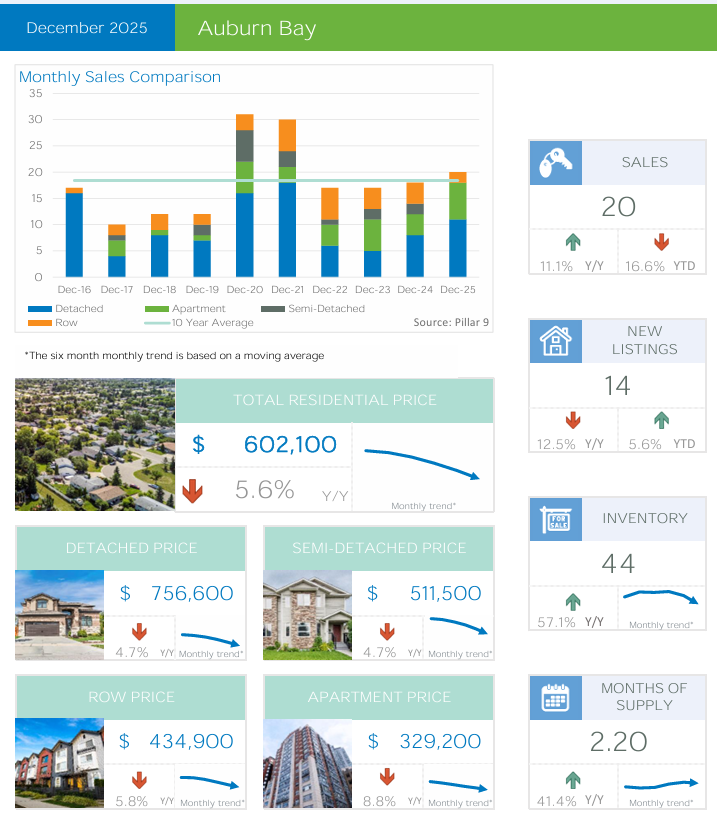
“Improved rental supply and easing rents have slowed ownership demand for apartment- and row-style homes. It is also these segments of the market that have seen October inventories reach a record high for the month,” said Ann-Marie Lurie, CREB®’s Chief Economist. “Excess supply for apartment- and row-style properties is weighing on prices in those segments more so than any other property type, influencing total residential prices.” 

As of October, the total unadjusted residential benchmark price in Calgary was $568,000, down nearly one per cent compared to last month and over four per cent lower than last year’s levels. The largest price adjustments occurred for row- and apartment-style properties where prices have eased by a respective six and seven per cent compared to last October. 

Detached

October sales reached 1,012 units, an improvement over last month, but still five per cent lower than last year’s levels. At the same time there were 1,593 new listings that came onto the market, causing the sales-to-new-listings ratio to rise to 64 per cent and inventories to trend down over last month to 2,913. Inventory levels remain slightly higher than long-term trends for the month, but with just under three months of supply, conditions remain relatively balanced and far better than conditions reported during the 2015 to 2019 period.

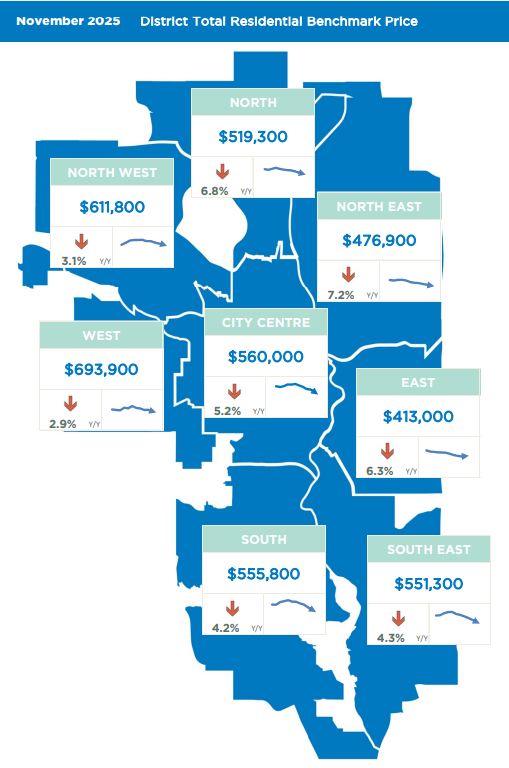
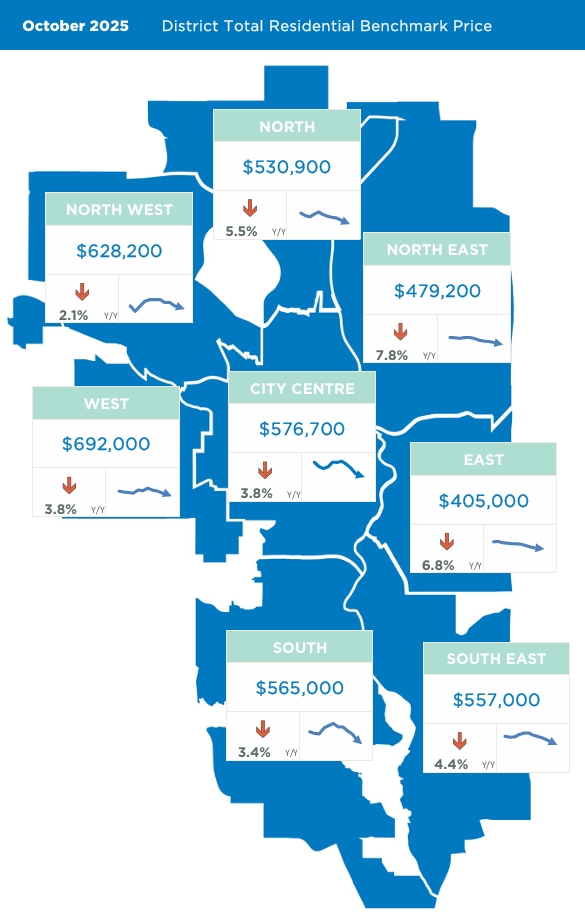
Despite relatively balanced conditions, there are pockets of the market that are experiencing buyer’s market conditions, which is impacting prices. Citywide detached benchmark prices eased to $744,400 in October, one per cent lower than last year. However, price adjustments ranged from a year-over-year gain of nearly two per cent in the City Centre to a decline of over five per cent in the North East district. Despite recent adjustments, year-to-date prices remain over one per cent higher than last year.  

Semi-Detached

Sales improved over last month while new listings slowed, causing the sales-to-new-listing ratio to rise to 57 per cent, which is slightly lower than typical levels for this time of year, but high enough to prevent any significant change in inventory levels compared to last month. With 186 sales and 613 units in inventory, the months of supply was over three months, higher than last year’s extremely low levels, but lower than last month.

More inventory choice has weighed on prices over the past several months. However, with an October benchmark price of $683,100, prices remain nearly one per cent higher than last year and on a year-to-date basis are over three per cent higher than last year. 

Row

With 275 sales in October, year-to-date row sales totaled 3,412 units, a 17 per cent decline over last year. While row sales remain well above long-term trends, new listings have been on the rise and reached record highs so far this year. As of October, there were 1,054 units in inventory, the highest ever reported for the month and nearly 32 per cent higher than long-term averages. This also caused the months of supply to remain around four months.

The additional supply choice has weighed on prices. The October benchmark price was $431,200, over one per cent lower than last month and nearly six per cent lower than prices reported last year at this time. The steady slide in row prices have caused year-to-date prices to drop by one-and-a-half per cent. Price adjustments did vary across the city with the largest year-to-date declines occurring in the North East and North districts. 


Apartment Condominium

The pullback in new listings relative to sales this month did help prevent further gains in inventory levels. However, with 1,891 units in inventory and 412 sales, the months of supply remained elevated at nearly five months. Apartment condominiums have been experiencing buyer’s market conditions for nearly 6 months, placing downward pressure on prices. As of October, the benchmark price was $318,200, down over one per cent compared to last month, and nearly seven per cent lower than last October.

On a year-to-date basis, prices are nearly two per cent lower than last year’s levels. The largest year-to-date price declines occurred in the North East and South East districts at four per cent, as those districts are either reporting the highest months of supply on the resale market or are facing significant competition from the new home market.

REGIONAL MARKET FACTS


Airdrie

Activity slowed as we moved into October. While sales have remained consistent with longer-term trends, new listings reached a record high for October, keeping inventories elevated. With 535 units in inventory and 136 sales, the months of supply remained over four months. The persistently higher months of supply over the past four months, combined with additional supply choice in the new home market, has weighed on resale home prices. Prices in Airdrie have been trending down since April of this year and as of October the benchmark price was $520,400, nearly one per cent lower than last month and nearly five per cent lower than last year’s levels. 

Cochrane

Sales in Cochrane improved this month, keeping year-to-date sales at levels that are relatively consistent with last year. At the same time, while levels remained high, new listings did trend down over last month, causing the sales-to-new-listings ratio to rise to 55 per cent and preventing any further gains in inventory levels. The months of supply eased to just over four months in October, higher than the low levels reported over the past several years, but relatively more consistent with long-term trends for the month. As of October, the benchmark price was $585,200, similar to last month and over two per cent higher than last year. Year-to-date prices in the area have risen by nearly four per cent. Some of the gain in prices could be related to a larger share of new homes ending up being sold on the resale market in Cochrane. 

Okotoks

October reported 91 new listings on the market, a significant gain over last month and last year’s levels. The rise in new listings was met with slower sales activity, causing the sales-to-new-listings ratio to dip below 50 per cent, supporting a modest gain in inventory levels. While inventory levels are finally improving, they remain low relative to longer-term trends. This has likely prevented a more significant shift in prices in the Okotoks area. In October, the unadjusted benchmark price was $618,600, up over last month but consistent with last October. Year-to-date benchmark prices have improved by over one per cent. 

Contact us for a Free Home Evaluation.

Read

🏡 Calgary Real Estate Market Update - Mahogany SE, Q3 2025
  • Total Sales: 139 (+57.9% Y/Y)

  • New Listings: 243 (+46.4% Y/Y)

  • Sales-to-New-Listings Ratio: 57.2% – a balanced to slightly seller-leaning market

  • Average Inventory: 159 (+65.9% Y/Y)

  • Months of Supply: 3.42 (+5.0% Y/Y)

  • Average Days on Market: 46 (+21.2% Y/Y)

  • Benchmark Price: $571,633 (▼ 5.0% Y/Y)

  • Median Price: $638,500 (▼ 7.9% Y/Y)

  • Average Price: $672,548 (▼ 10.7% Y/Y)

Despite softer prices, Mahogany remains one of Calgary’s most active lake communities, with buyer activity well above its 10-year average (81 quarterly sales).


Market Trends by Property Type

Detached Homes

  • Sales: 72

  • Benchmark Price: $806,367 (▼ 1.9% Y/Y)

  • Median Price: $755,000 (▼ 5.6% Y/Y)

  • Average Price: $816,008 (▼ 9.7% Y/Y)
    Detached listings continue to dominate, with strong demand for family-sized two-storey homes near the lake. Price adjustments indicate buyers are showing greater price sensitivity amid higher inventory.

Semi-Detached Homes

  • Benchmark Price: $571,767 (▼ 1.5% Y/Y)

  • Median Price: $604,950 (▼ 2.4% Y/Y)

  • Average Price: $539,540 (▼ 4.7% Y/Y)
    Semi-detached units saw modest price declines and balanced turnover, attracting entry-upsize buyers seeking proximity to amenities without detached-level pricing.

Row / Townhomes

  • Benchmark Price: $483,200 (▼ 2.9% Y/Y)

  • Median Price: $536,000 (▼ 4.7% Y/Y)**
    Row homes remain competitive options for young professionals and investors, with stable absorption and affordability relative to detached homes.

Apartments

  • Benchmark Price: $344,100 (▼ 7.7% Y/Y)

  • Median Price: $356,500 (▼ 11.8% Y/Y)
    Apartment prices show the steepest year-over-year decline, but the segment benefits from continued rental demand and increased investor interest due to Calgary’s strong population growth.


Price Distribution

The majority of Mahogany’s Q3 2025 sales occurred between $600,000 – $799,999, followed by activity in the $400,000 – $599,999 band. Luxury homes ($1 million +) represent a smaller but steady niche.


Market Insights

  • The increase in listings and modestly slower absorption suggest a normalizing market following the pandemic-era highs.

  • Buyers have more selection, particularly in apartment and mid-range detached homes.

  • Sellers remain in a good position if pricing realistically and emphasizing community lifestyle value.


Community News (Fall 2025)

Mahogany continues to enhance its family-focused, lake-lifestyle community:

  • Mahogany Harvest Market at West Beach (October 2025): Local artisans, produce, and food vendors celebrate the season.

  • Mahogany Urban Village Progress: Ongoing commercial and retail expansion (restaurants, clinics, boutique services) strengthens walkability and local amenities.

  • Future Infrastructure: Anticipated completion of new southeast Calgary transit corridor will improve accessibility for commuters by 2026.


Heading into Q4 2025, Mahogany’s market is expected to stabilize further, with inventory levels moderating and prices holding near current benchmarks. The community’s lake access, school catchments, and vibrant amenities continue to make it one of the most desirable master-planned areas in Calgary’s southeast.

Contact us for a Free Home Evaluation.

Read

SEPTEMBER 2025 HOUSING MARKET UPDATE

A boost in new listings drives further inventory gains and price adjustments

The 1,720 sales in September were not high enough to offset the 3,782 new listings coming onto the market, driving further inventory gains as we move into the fall. There were 6,916 units in inventory in September, 36 per cent higher than last year and over 17 per cent higher than levels traditionally reported in September. Both row and apartment style homes have reported the largest boost in supply compared to long-term trends. 

“Supply levels have been rising in the resale, new home and rental markets. The additional supply choice is coming at a time when demand is slowing, mostly due to slower population growth and persistent uncertainty. Resale markets have more competition from new homes and additional supply in the rental market, reducing the sense of urgency amongst potential purchasers. Ultimately, the additional supply choice is weighing on home prices,” said Ann-Marie Lurie, CREB® Chief Economist. 

Supply levels relative to demand typically drive shifts in home prices. In September, the sales to new listings ratio dipped to 45 per cent, and the months of supply pushed up to four months for the first time since early 2020. This is a higher level of supply compared to demand than is typically seen in the Calgary market and, should this persist, we could see a market that shifts more in favour of the buyer. However, conditions do vary by property type, price range and location. 

Inventory gains for apartment style homes over the past several months have contributed to buyer market conditions in this segment, driving year-over-year price adjustments of over six per cent for a total benchmark price of $322,900 in September. While the detached segment has also seen a rise in the months of supply, it has not been as high as the apartment condo sector. At a benchmark price of $749,900, detached home prices are only one per cent lower than last year, with most of the adjustments driven by the North East and North districts.

Detached

Sales in September slowed to 859 units, nine per cent lower than last year and below long-term trends for September. At the same time, new listings rose to 1,905 units, causing the sales to new listings ratio to fall to 45 per cent, levels not seen since 2018. While there has been an unexpected shift in September, it is too early to tell if this trend will continue as prior to this month the detached market has remained relatively balanced.  

Improved supply choice is causing prices to decline relative to the record highs reported during the spring. As of September, the unadjusted benchmark price was $749,900, down nearly one per cent from both last month and last year. While prices have eased from peak levels across all districts, the largest decline occurred in the North East and East district at over six per cent. Despite recent adjustments on a year-to date basis, prices remain nearly two per cent higher than last year’s levels, with the City Centre reporting the highest gain at over four per cent. 


Semi-Detached

New listings rose to 361 units in September, while sales fell to 156 units, causing the sales to new listings ratio to drop to 43 per cent. This also caused a rise in inventory levels and the months of supply pushed up to nearly four months. This is a significant shift compared to last month, where there was less than three months of supply. 

Like the detached sector, it is too early to say if this trend will continue, but so far it has had minimal impact on home prices. As of September, semi-detached price was $684,800, slightly lower than last month and nearly one per cent higher than last year. Year-to-date price growth has been the highest for semi-detached homes at over three per cent, as this segment took longer to shift from a seller's market to one that was more balanced. Most of the price growth was driven by gains reported in the City Centre. 


Row

Following a pullback last month, new listings posted modest monthly gains. The 592 new listings were met with 304 sales, causing the sales to new listings ratio to fall to 51 per cent. This is not as low as the other property types and at these levels it was enough to prevent any further monthly gain in the already elevated inventory levels. September inventory levels were 1,099 units, the highest September level reported since 2018, and 30 per cent higher than longer-term trends for the month. The largest gains in inventory occurred in the North East district, which also reported the highest months of supply and price decline compared to last year. 

More supply choice has impacted resale prices, with the unadjusted benchmark price being $437,100. This is down less than one per cent over last month and nearly five per cent lower than last year’s prices. Year-to-date price adjustments have been much smaller at one per cent, as declines in the North East, North and South East districts offset the gains reported in other parts of the city. 


Apartment Condominium

The most significant adjustment in the market occurred in the apartment condominium sector as improving rental supply, delayed adjustments in interest rates and improved selection for other property types has slowed apartment style demand from both first-time buyers and investors. September reported 401 sales and 924 new listings, dropping the sales to new listings ratio to 43 per cent and causing inventory to rise to 1,999 units. 

The rise in supply caused the months of supply to push up to five months, the first time it has done that since 2021. As elevated levels of supply have persisted since June, prices have been trending down. As of September, the benchmark price was $322,900, down over one per cent compared to last month and over six per cent compared to last year. The year-to-date price adjustment has been just over one per cent. Condo prices have slid across all districts compared to last September. The largest decline occurred in the North East district at over ten per cent, while the smallest decline occurred in the City Centre at five per cent. 


REGIONAL MARKET FACTS


Airdrie

New listings reached a September record high with 295 units. The gains in new listings were met with a pullback in sales causing the sales to new listings ratio to fall to 45 per cent and inventory rose to 571 units. While inventories have been generally trending up throughout this year, this is the first time that the months of supply pushed above four months since 2020. The improved options weighed on home prices, which continued to trend down this month. In September, the unadjusted benchmark price was $526,000, down one per cent compared to last month and nearly five per cent lower than last year's levels. Despite recent adjustments year-to-date prices declined by just over one per cent, not enough to offset last year's annual growth of eight per cent. 
 

Cochrane

New listings in Cochrane also hit a September record high with 148 units. While sales are similar to last year's levels at 62 units, the boost in new listings did cause the sales to new listings ratio to drop to 42 per cent this month. This led to further inventory gains and the months of supply pushed above five months. Improved supply levels also took more pressure off home prices this month. In September, the unadjusted benchmark price was $584,300, down by nearly one per cent compared to last month, but still one per cent higher than last year's levels. Much of the supply adjustment has only recently occurred in the Cochrane market and the year-to-date benchmark price remains nearly four per cent higher than last year. 
 

Okotoks

Okotoks was one of the few larger areas that did not see a lift in new listings in September. The 69 new listings were down compared to levels reported last year, and with 51 sales this month, the sales to new listings ratio remained elevated at 74 per cent. While inventory levels were only slightly higher than last month, the months of supply has remained relatively low at two and a half months. Despite the relatively tight conditions, prices continued to adjust in the market. This in part can be related to the competition from new properties, impacting resale prices. As of September, the total residential benchmark price was $613,900, down by over one per cent compared to last month and nearly three per cent lower than last September. Despite the adjustment, on a year-to-date basis, prices were still one and a half per cent higher than last year. 

Read

Calgary Latest Real Estate Market Update - Auburn Bay, Q3 2025
  • Total sales: 118 — up 11.3% year-over-year.

  • New listings: 164 — up 8.6% Y/Y; sales/new-listings (S/NL) ratio ~72%, indicating a still-active market with solid absorption of new supply.

  • Benchmark price: $620,867, down ~3.5% Y/Y; Median price: $545,500; Average price: $593,235.

  • Average days on market (DOM): 37 days

Market trends by property type

Detached

  • Sales: 54 (largest share of Q3 sales).

  • Benchmark price (detached): ~$804,300; median detached price ~$748,650. Detached benchmark shows small Q/Q and Y/Y movements but remains the highest among types.

  • Trend: Detached homes continue to lead sales by volume and price; market remains competitive compared with other types, though benchmark has softened modestly Y/Y.

Semi-detached

  • Sales: 13

  • Benchmark price: $524,600

  • Trend: Smaller sales volume but stronger price stability — semi-detached prices near mid-market and showing modest annual change.

Row (townhouse)

  • Sales: 15

  • Benchmark price: $455,233

  • Trend: Townhomes remain an important mid-price option; inventory and months-of-supply indicate buyers have more choice than for detached product.

Apartment

  • Sales: 36 

  • Benchmark price: $351,500 

  • Trend: Apartment product represents the entry price point for many buyers; benchmark and median are considerably lower than other types, supporting demand from first-time and downsizing buyers.

Inventory & market balance

  • Average inventory: 89 active listings and months of supply ≈ 2.25 months — a sellers’/balanced leaning market (under ~3 months typically indicates tighter conditions).

  • S/NL ratio ~72% — shows strong absorption of newly listed stock, keeping upward pressure on prices in pockets despite a modest Y/Y benchmark decline.

Buyer / seller signals

  • Faster turnover suggests buyers are still active — however benchmark price decline Y/Y (-3.5%) indicates some price pressure overall, likely reflecting broader market conditions (higher borrowing costs, seasonal shifts, or more supply in certain price bands).

  • Price segmentation: Detached remains highest-priced; apartments and row units provide more affordable entry points — expect continued demand for mid/affordable price ranges.

Quick takeaways for sellers / buyers

  • Sellers: Proper pricing still matters — strong S/NL ratio and DOM ~37 means well-priced homes move; detached properties command the top dollar.

  • Buyers: More choices in apartment/row segments and slightly softer benchmark prices create opportunities for negotiation, especially off-peak or in higher inventory price bands.

  • Investors: Months of supply (~2.25) and S/NL near 72% show continued demand; monitor mortgage-rate developments and vacancy/condo supply if pursuing apartments.

Contact us for a Free Home Evaluation.

Read

Calgary Latest Real Estate Market Report – Rangeview SE (Q3 2025)

Rangeview continued its steady growth trajectory in Q3 2025, reflecting the area’s rising appeal as one of southeast Calgary’s most vibrant and family-friendly communities.

  • Total Sales: 38, representing a 100% year-over-year increase.

  • New Listings: 73, up 143% from the same quarter in 2024.

  • Sales-to-New Listings Ratio: 52.1%, indicating a balanced market.

  • Average Inventory: 53 units, up 169% year-over-year.

  • Months of Supply: 4.18, suggesting more selection for buyers compared to earlier quarters.

  • Average Days on Market: 50 days, slightly longer than last quarter as inventory expanded.

The median residential price settled at $637,950, showing a 1.1% annual decrease, while the average price was $656,954, down 4% year-over-year. Despite minor softening in prices, market activity remained strong across most property types.


Market Trends by Property Type

  • Detached Homes:

    • 28 sales, up 86.7% year-over-year.

    • Median price: $661,750, showing a 1.0% annual increase.

    • Average price: $683,312, down slightly by 3%.

    • Demand for detached homes remains high, supported by strong new home construction and family migration to Rangeview.

  • Semi-Detached Homes:

    • 7 sales, a 133% increase compared to last year.

    • Median price: $630,000, up 5% year-over-year, though the average price dipped slightly to $610,057.

    • Moderate inventory growth (up over 500%) provided more options, keeping the segment competitive.

  • Row Homes:

    • 3 sales, up 200% year-over-year.

    • Median price: $520,000, marking a 4.8% annual decline but still strong relative to other southeast communities.

    • Average price: $520,373, down 4.7%, consistent with a shift toward more affordable attached housing.


Community Development & Features

Rangeview continues to evolve as a vibrant “agrihood”—a first-of-its-kind community in Calgary designed around urban agriculture, sustainability, and wellness.

  • Community Gardens & Greenhouses: Residents enjoy access to shared gardens, greenhouse facilities, and seasonal markets, encouraging a strong sense of local connection.

  • Walkable Design: The community features pedestrian-friendly streets, playgrounds, and future retail zones, designed for family living.

  • Proximity to Seton Urban District: Just minutes away from Seton Shopping Centre, Cineplex VIP Cinemas, and numerous restaurants, providing all urban conveniences.

  • Access to South Health Campus: Rangeview is located near the South Health Campus, Calgary’s leading medical facility offering:

    • 24/7 emergency and trauma care

    • Specialized medical services including cardiac, orthopedic, and oncology care

    • Wellness, physiotherapy, and outpatient clinics

    • Research and teaching programs affiliated with the University of Calgary


With expanding housing diversity, rising infrastructure investment, and sustainable community planning, Rangeview is positioned for long-term growth. While price adjustments are moderating short-term gains, buyer demand remains robust, especially among young families and professionals drawn to the area’s modern amenities and proximity to healthcare and retail hubs.

Contact us for a Free Home Evaluation.

Read

🏙 Calgary Real Estate Market Update - Seton Q3 2025

Q3 2025 activity in Seton remains strong versus its 10-year average (only 21 quarterly sales historically). Inventory growth and slightly longer selling times show the market cooling from 2023-24 highs, but buyer demand continues thanks to Seton’s live-work-shop convenience.

MetricQ3 2025 ValueY/Y Change
Sales78+56 %
New Listings157+40 %
Sales/New Listings Ratio49.7 %Balanced market
Average Inventory120+132 %
Months of Supply4.62+49 %
Average Days on Market59+116 %
Benchmark Price$472,400▼ 2.1 %
Median Price$431,337▼ 1.7 %
Average Price$459,129▼ 4.1 %

Market Trends by Property Type

Detached Homes

  • Benchmark Price: $753,033 (▼ 2.7 % Y/Y)

  • Median Price: $705,450 (▼ 7.2 %)

  • Average Price: $709,356 (▼ 6.5 %)

  • Average DOM: 76 days
    Detached remains the premium segment. Price softening reflects higher inventory (6.4 months of supply), but demand persists for newer 2020-built two-storey homes averaging 1,786 sq ft

Semi-Detached Homes

  • Benchmark Price: $583,500 (▼ 1.6 %)

  • Median Price: $598,000 (+ 2.3 %)

  • Average Price: $584,500 ( no change )
    Balanced conditions; affordability attracts young families and move-up buyers. Semi-detached units average 1,128 sq ft above grade, built 2019-2020.

Row Townhomes

  • Benchmark Price: $470,733 (▼ 1.0 %)

  • Median Price: $442,000 (▼ 9.7 %)
    Townhome supply rose, creating more buyer choice. This segment remains the entry point for homeowners seeking attached living close to amenities.

Apartments

  • Benchmark Price: $362,467 (▼ 4.4 %)

  • Median Price: $340,000 (▼ 9.3 %)
    Condo demand stays solid thanks to affordability, though price corrections reflect rising inventory. Many units are modern 2-bedroom suites (~883 sq ft) built 2019.


Price Bands & Market Balance

Most Q3 2025 transactions occurred between $400K – $699K.
Apartments dominate the lower brackets (< $400K), while detached homes anchor $700K – $900K.
Sales-to-new-listings ratio ≈ 50 % and 4.6 months of supply = balanced market—neither strongly buyer nor seller-favoured.


🏘 Community News & Events (Fall 2025)

Seton Urban District Expansion
Construction continues on the Seton South Urban Centre, adding new retail, dining, and residential spaces by mid-2026.

Brookfield Residential Community Events

  • Seton Night Market (Fall Series) – Local vendors, live music at Seton Urban District Plaza.

  • Halloween in the Square – Family-friendly trick-or-treat and pumpkin walk.

  • Seton Wellness Week – Partnership with South Health Campus offering free fitness and nutrition seminars.

Transportation & Infrastructure

  • Calgary Transit Green Line Stage 1 construction progresses north of Seton, expected to connect to the community by 2027.

  • Improved access to Deerfoot Trail and Stoney Trail has reduced commute times to downtown.


🏫 Schools Serving Seton

Public Schools

  • Joane Cardinal-Schubert High School (gr. 10-12) — located within Seton.

  • Cranston School (K-6) and Dr. George Stanley School (5-9) serve adjacent areas until a dedicated Seton K-9 school opens.

Catholic Schools

  • Our Lady of the Rosary School (K-6) – Cranston.

  • All Saints High School (gr. 10-12) – Seton.


Seton’s Q3 2025 figures show a healthy, balanced market:

  • Prices have moderated after rapid pandemic-era growth.

  • Inventory expansion is creating opportunities for first-time buyers and investors.

  • Ongoing commercial and infrastructure growth keeps Seton one of Calgary’s fastest-developing urban centres.

Contact us for a Free Home Evaluation.

Read

卡尔加里最新房地产市场报告:9月份供给增加,推库上升,价位调整

卡尔加里9月份的二手民宅一共卖掉1,720套,不足以抵消市场上新增的3,782个挂牌,推动库存在秋季继续上升。9月份库存总量达到6,916套,比去年同期高出36%,也比历年9月通常水平高出17%以上。联屋和公寓类住宅的供应量相比长期趋势增幅最大。

二手房、新房和租赁市场的供应水平均在上升。增加的供给选择整好出现在买家需求放缓的时期,主要由于人口增长放缓和持续的不确定性。二手房市场面临来自新房和租赁市场新增供应的更多竞争,降低了潜在买家的紧迫感。最终,增加的供给房源给价位上涨形成压力。‍

通常,供需关系的变化会推动房价的波动。9月份,销售与新增挂牌比率下降至45%,库存月数首次自2020年初以来升至4个月。这一水平的供应相对于需求高于卡尔加里市场通常的状况,如果持续下去,市场可能会逐渐向买方倾斜。不过,具体情况仍因房产类型、价格区间和地段而异。‍

过去几个月,公寓类住宅的库存增加,推动该细分市场进入买方市场状态,导致房价同比下调超过6%,9月份的市场基准价为$322,900。虽然独立屋板块的库存月数也有所上升,但幅度不及公寓市场。在$749,900的市场基准价下,独立屋价格仅比去年下降1%,且大部分调整主要集中在东北区和北区。

独立屋(Detached)

9月份独立屋销售放缓至859套,比去年下降9%,并低于9月的长期趋势。同时,新挂牌上升至1,905套,使销售与新挂牌比率降至45%,这一水平自2018年以来未曾出现。尽管9月份市场出现了意外变化,但尚难判断这一趋势是否会持续,因为在此之前,独立屋市场整体仍保持相对平衡。

随着供应选择的增加,价格相较于春季创下的历史高点有所下降。9月份的市场基准价为$749,900,环比和同比均下降近1%。虽然各区域价格均从峰值回落,但降幅最大的为东北区和东区,超过6%。尽管近期有所调整,但年初至今的价格仍较去年高出近2%,其中市中心涨幅最高,超过4%。


半独立屋(Semi-Detached)

月份新挂牌上升至361套,而销售下降至156套,使销售与新挂牌比率降至43%。这也推动库存增加,供应月数接近4个月,相比上月不到3个月的水平出现明显上升。

与独立屋类似,目前仍难以判断这一趋势是否会延续,但迄今对房价影响不大。9月份半独立屋价格为$684,800,略低于上月,较去年高出近1%。年初至今,半独立屋价格增幅最高,超过3%,因为该板块从卖方市场转向更平衡状态的时间更长。大部分价格增长来自市中心的带动。


排屋(Row/Townhouses)

继上月回落后,9月份新挂牌小幅增长。592笔新挂牌对应304笔销售,使销售与新挂牌比率降至51%。虽然比其他物业类型略高,但这一水平足以阻止已经偏高的库存进一步增长。9月份库存为1,099套,是自2018年以来最高的9月水平,比该月长期趋势高出30%。库存增长最多的为东北区,该区的供应月数最高,价格同比降幅也最大。

更多的供给影响了成交价格,9月份的市场基准价为$437,100,环比下降不足1%,同比下降近5%。年初至今的价格调整幅度较小,仅1%,主要因为东北、北部和东南区的降幅抵消了其他区域的涨幅。


共管公寓(Apartments)

市场中最显著的调整出现在公寓板块。随着租赁供应增加、利率调整延后以及其他物业类型选择的改善,首次购房者和投资者对公寓的需求有所放缓。9月份成交401笔,新挂牌924笔,使销售与新挂牌比率降至43%,库存增加至1,999套。

供应增加推动供应月数升至5个月,这是自2021年以来首次出现。由于自6月以来供应持续偏高,价格呈下行趋势。9月份的市场基准价为$322,900,环比下降逾1%,同比下降超过6%。年初至今的价格调整幅度略高于1%。与去年同期相比,各区公寓价格均出现下滑,东北区降幅最大,超过10%;市中心降幅最小,为5%。

卡尔加里周边城镇

Airdrie

9月份新挂牌达到295套,创下历年同期新高。但销售回落,使销售与新挂牌比率降至45%,库存增加至571套。今年以来库存整体呈上升趋势,而这是自2020年以来供应月数首次超过4个月。更多的供应选择对房价形成压力,本月价格继续下行。9月份的市场基准价为$526,000,较上月下降1%,较去年下降近5%。尽管近期有所回调,但年初至今价格仅下降约1%,不足以抵消去年8%的年度增长。


Cochrane

9月份的新挂牌同样创下同期新高,达到148套。虽然62笔销售与去年持平,但新增挂牌的大幅增加使销售与新挂牌比率降至42%,推动库存进一步上升,供应月数突破5个月。供应水平的改善也缓解了房价压力。9月份的市场基准价为$584,300,环比下降近1%,但仍比去年同期高出1%。由于供应调整主要是近期才出现,年初至今的基准价仍比去年高出近4%。


Okotoks

这是少数几个9月份未见新挂牌增长的主要区域之一。69笔新挂牌低于去年的水平,而本月销售为51笔,使销售与新挂牌比率保持在74%的高位。库存水平仅较上月略高,供应月数仍维持在约2.5个月的低位。尽管市场相对紧张,但价格仍在调整,这部分与新房竞争影响转售价格有关。9月份整体住宅基准价为$613,900,环比下降逾1%,同比下降近3%。不过,年初至今的价格仍比去年高出1.5%。

-Jesus loves you-
-Invite God Into Your Situation-

更多信息,请看链接

Read

The latest Calgary Elementary Schools Ranking
  • Publication Date & Scope: The Fraser Institute's 2024 "Report Card on Alberta’s Elementary Schools" was released in 2024, covering 730 schools across public, separate, independent, and charter systems

  • Improvement Spotlight — Banff Elementary: Among the most notable stories of improvement, Banff Elementary School (public) rose from a score of 6.1 in 2017 to an impressive 9 in 2023


Calgary’s Top Performers in 2022–23 (per available data)

While the 2024 public release didn’t outline Calgary’s full ranking list, earlier data (2022–23) offers insights into top schools in Calgary:

  • Clear Water, Master’s, Renert, and Webber all achieved a perfect 10/10 rating and are tied for 1st place among all of Alberta

  • Other high performers include:

    • Calgary French & International — 9.8 (rank 5)

    • Holy Name, Sunalta — 9.6 (rank 9)

    • Louis Pasteur, Rundle College — 9.4 (rank 13)

    • St. Joan of Arc — 9.3 (rank 16)

These top-caliber schools are clustered among both public and private institutions.


FFCA Charter Schools — 2025 Update

  • The Foundation for the Future Charter Academy (FFCA), which includes six combined elementary-middle campuses, achieved an overall provincial rank of 28 out of 858 elementary-level schools, placing them in the 97th percentile. This marks their highest-ever ranking to date.


A Balanced View

It’s worth noting that the Alberta Teachers Association (ATA) and certain school divisions have criticized the Fraser Institute’s methodology. They argue that the rankings:

  • Rely heavily on Provincial Achievement Test (PAT) results.

  • Do not account for socioeconomic context, student diversity, special needs, and broader school qualities 


What Parents Should Consider

Rankings offer useful starting points but shouldn’t drive decisions alone. Consider:

  • Visiting schools in person.

  • Talking to administrators and teachers.

  • Reviewing programs beyond test scores.

  • Assessing school atmosphere, values, and fit with your child’s needs.

Read

AUGUST 2025 HOUSING MARKET UPDATE

Price declines mostly driven by higher density home types

Improving supply choice has changed the dynamics of the Calgary market driving price declines over the past several months. Higher price adjustments are occurring for apartment and row style properties while detached and semi-detached properties have reported modest declines. As of August, the unadjusted total residential benchmark price was $577,200, down over last month and nearly four per cent lower than levels reported last year.

“Perspective is needed when it comes to price adjustments. The most significant price adjustments are occurring for row and apartment style homes as they are also the product type that are facing the largest gains in supply choice,” said Ann-Marie Lurie, Chief Economist at CREB®. “Meanwhile price adjustments in the detached and semi-detached markets range from modest price growth in some areas to larger price declines in areas with large supply growth. Overall, recent price adjustments have not offset all the gains that have occurred over the past several years.”

August reported 1,989 sales, nearly nine per cent lower than last year. Sales have slowed compared to the high levels reported over the past four years. However, activity is still above long-term trends, reflecting relatively strong demand. What has changed is the supply situation. New listings remain elevated, keeping the sales-to-new-listings ratio below 60 per cent and pushing inventory to 6,661, the highest August amount since 2019. 

More inventory choice coupled with lower sales has caused the months of supply to rise to 3.4 months in August, much higher than the sellers' market conditions reported over the previous four years, but still well below the buyer market conditions observed prior to the pandemic. While the market is much more balanced compared to last year, there is significant variation depending on property type, price range and location.   

Detached

Detached home sales eased to 995 units in August, while new listings rose to 1,748 units, keeping the sales-to-new listings ratio below 60 per cent. This prevented any significant shift in inventory, as the 3,051 units were the highest levels reported in August since 2020. Higher inventory levels and easing supply have helped balance out the detached market. However, districts like the North East, North and East are experiencing buyer market conditions.   
  
The unadjusted benchmark price in August was $755,600 down by nearly one per cent over last month and last year's levels. While prices have eased there is significant variation depending on location. Compared to last year, prices reported the largest decline in the North East and East district at five per cent, while prices in the city centre were over two per cent higher. As many of the adjustments have occurred over the past few months, year-to-date Calgary prices remain two per cent higher than last year.
 

Semi-Detached

August sales improved over last year’s levels, but it was not enough to offset earlier pullbacks with year-to-date sales of 1,557—eight per cent lower than last year—but higher than long-term trends. At the same time, new listings slowed compared to sales pushing the sales-to-new listings ratio up to 67 per cent and preventing any further monthly inventory gains. Inventory gains have not been as high for this product type, and the months of supply remained below three months in August. This is one of the reasons that the prices have not seen the same adjustment.
 
In August the unadjusted benchmark price was $687,200 down over last month, but nearly one per cent higher than last year, and nearly four per cent higher on a year-to-date basis. Price growth has varied across the city, with the largest year-over-year gains occurring in city centre. Meanwhile the largest declines have occurred in the North East, East and North districts.
 

Row

Sales in August slowed, contributing to the year-to-date decline of nearly 16 per cent. While new listings did ease in August compared to last year and last month, they have generally been on the rise pushing up inventory levels. In August, there were 1,103 units in inventory, reaching the second highest level on record for August, only slightly lower than the record high in reported in 2018. Due to the relatively strong sales, the months of supply has only pushed slightly above three months, far more balanced than last year, but not as high as the 6.4 months report back in 2018.
 
Nonetheless, additional supply choice has weighed on prices. In August, the unadjusted benchmark price in the city was $439,600, reflecting the fourth consecutive monthly decline and nearly five per cent lower than last August. While prices eased across all districts, price declines exceeded five per cent in the North East, North, South and East districts. These districts generally reported high levels of supply in the resale sector or had significant competition from new home supply.


Apartment Condominium

Sales continue to slow in August contributing to a year-to-date pullback of nearly 30 per cent. While sales are still above long-term trends, they have not been high enough to offset the level of new listings in the market. In August alone there were 877 new listings compared to the 449 sales, keeping the sales-to-new-listings ratio relatively low at 51 per cent. The low ratio that has persisted throughout this year has contributed to the higher inventory levels seen in the market. While August inventory levels did not rise over last month, with 1,979 units available, this is the highest August inventory ever reported.
 
The months of supply for apartment condos have remained around four months since June. The excess supply relative to demand has been weighing on prices. As of August, the unadjusted benchmark price was $326,500, reflecting the fifth consecutive monthly decline and nearly six per cent lower than levels reported last August. Most of the supply is concentrated in the City Centre, which reported a year-over-year decline of five per cent, slightly higher than the rate of decline reported in the West district at three per cent. Meanwhile, the highest price declines occurred in the North East district at over 11 per cent.


REGIONAL MARKET FACTS


Airdrie

Easing sales in August contributed the year-to-date decline of 12 per cent for 1,248 sales so far this year. The 152 sales this month was met with 265 new listings, pushing the sales-to-new listings ratio up to 57 per cent and preventing any further monthly inventory gains. As of August, there was 535 units in inventory, above long-term trends and the highest levels reported since before the pandemic. The rise in supply has helped shift the market to more balanced conditions. However, with more supply options in both the new home, resale markets and in competing locations, there has been some downward pressure on prices in Airdrie. In August, the unadjusted total residential benchmark price was $531,100, down over last month and four per cent lower than levels reported last August.


Cochrane

The 70 sales this month were met with 139 new listings causing the sales-to-new listings ratio to fall to 50 per cent, the lowest ratio reported for August since 2015. The pullback in sales compared to new listings prevented any significant shift in inventory levels, pushed the months of supply up above four months. Despite the shift this month, prices in Cochrane remained relatively stable in August, with the unadjusted benchmark price sitting at $589,100, similar to last month and nearly two per cent higher than last year. On a year-to-date basis prices are four per cent higher than the previous year.


Okotoks

New listings in August reported a significant pullback relative to sales and the sales-to-new-listings ratio pushed up to 80 per cent. While sales have generally remained in line with long-term trends, new listings have not had the same increase that other areas have reported, preventing significant gains in inventory levels. As of August, there was 116 units in inventory, a 29 per cent gain over last year, but still 30 per cent lower than levels traditionally seen in August. Despite tighter conditions, prices have reported some monthly declines. However, year-to-date benchmark prices remained two per cent higher than last year’s levels, with gains reported across each property type.

Contact us for FREE HOME EVALUATION.

Read
Data is supplied by Pillar 9™ MLS® System. Pillar 9™ is the owner of the copyright in its MLS®System. Data is deemed reliable but is not guaranteed accurate by Pillar 9™.
The trademarks MLS®, Multiple Listing Service® and the associated logos are owned by The Canadian Real Estate Association (CREA) and identify the quality of services provided by real estate professionals who are members of CREA. Used under license.