RSS

Millrise Real Estate Market Summary – January 2025

Market Trends by Property Type

  1. Detached Homes

    • Sales: 5 homes sold (unchanged from last year).

    • Inventory: 8 homes available (up 60% year-over-year).

    • Benchmark Price: $593,200 (16% increase year-over-year).

  2. Semi-Detached Homes

    • Sales: 0 homes sold (down 100% year-over-year).

    • Inventory: 0 homes available (100% decrease).

    • Benchmark Price: $553,300 (11% increase year-over-year).

  3. Row/Townhouses

    • Sales: 1 home sold (N/A compared to last year).

    • Inventory: 0 homes available (100% decrease).

    • Benchmark Price: $403,700 (9% increase year-over-year).

  4. Apartments

    • Sales: 4 units sold (up 300% year-over-year).

    • Inventory: 3 units available (down 40% year-over-year).

    • Benchmark Price: $328,600 (7% increase year-over-year).

Overall Market Performance

  • Total Sales: 10 (up 43% year-over-year).

  • New Listings: 11 (down 8% year-over-year).

  • Total Inventory: 9 properties (up 29% year-over-year).

  • Benchmark Price (All Property Types): $461,100 (10.1% increase year-over-year).

  • Months of Supply: 0.90 months (indicating a seller’s market).

2025 Real Estate Outlook for Millrise

  • Continued Price Growth: Benchmark prices have been rising across all property types, suggesting strong demand despite increasing inventory levels.

  • Shift in Demand: Apartments are seeing significant growth in sales, likely due to affordability concerns as detached and semi-detached home prices increase.

  • Tight Market Conditions: With less than one month of supply, Millrise remains a seller’s market, but rising inventory could gradually balance conditions.

  • Potential Interest Rate Impact: If interest rates stabilize or decline, more buyers may enter the market, further supporting price increases and higher sales volume.

Overall, Millrise’s real estate market is poised for continued appreciation in 2025, with strong demand for apartments and detached homes driving market activity. Buyers should act quickly in this competitive landscape, while sellers may see favorable conditions persist.

Contact us for a Free Home Evaluation.

For the latest community market report, SIGNUP HERE.

Read

Coventry Hills Real Estate Market Summary – January 2025

Market Trends

  • Detached Homes: The benchmark price for detached homes reached $600,900, showing a 5% increase year-over-year.

  • Semi-Detached Homes: The benchmark price rose to $524,900, marking a 6% increase from the previous year.

  • Row Houses: The benchmark price for row houses was $375,800, which remained unchanged year-over-year.

  • Apartments: No data available for apartments.

  • Total Residential Market: The overall benchmark price for residential properties was $577,900, reflecting a 4.6% increase year-over-year.

Sales and Inventory

  • Total residential sales for January 2025 were 18, representing a 50% increase from last year.

  • New listings stood at 13, marking an 8% increase compared to last year.

  • Inventory levels increased to 12 active listings, a 20% rise year-over-year.

  • Months of supply was 0.67, indicating a strong seller’s market with limited inventory.

2025 Real Estate Outlook

  • Continued Growth: Coventry Hills has seen consistent price appreciation, particularly in detached and semi-detached homes, suggesting strong demand.

  • Supply Constraints: With low months of supply, homebuyers may face competition, pushing prices higher.

  • Balanced Market Potential: If inventory increases in the coming months, Coventry Hills could move towards a more balanced market.

  • Investment Appeal: The steady growth and affordability compared to other Calgary neighborhoods make Coventry Hills an attractive choice for buyers and investors.

Read

Somerset Real Estate Summary – January 2025

Market Overview

The Somerset real estate market in January 2025 experienced a slight decline in total residential sales, with 12 properties sold, marking an 8% year-over-year (Y/Y) decrease. Despite the drop in sales, new listings surged by 78% Y/Y, reaching 16 properties, contributing to a rise in inventory levels, which jumped 333% Y/Y to 13 available homes.

The benchmark residential price increased by 4% Y/Y, reaching $476,600. The months of supply stood at 1.08, indicating a shift towards a more balanced market compared to previous months.

Market Trends by Property Type

  • Detached Homes:

    • The benchmark price rose to $621,200, up 7.7% Y/Y.

    • 8 detached homes were sold, reflecting a 100% Y/Y increase.

    • Inventory increased by 100% Y/Y, giving buyers more options.

  • Semi-Detached Homes:

    • No sales were recorded for this segment in January 2025.

    • Inventory and months of supply remained at zero.

  • Row/Townhomes:

    • Only 1 row home was sold, showing no change from the previous year.

    • The benchmark price increased by 9% Y/Y to $400,600.

    • Inventory remained stable.

  • Apartments:

    • Sales dropped 63% Y/Y, with only 3 units sold.

    • The benchmark price increased 9% Y/Y to $302,100.

    • Inventory rose 75% Y/Y, reaching 7 available units.

2025 Real Estate Outlook

  • Continued Price Growth: Despite fluctuations in sales volume, home prices are expected to continue their steady appreciation.

  • Inventory Expansion: With new listings increasing significantly, buyers may find more options in the Somerset market.

  • Balanced Market Conditions: The sales-to-new listings ratio (S/NL) is 0.75, suggesting a shift from a strong seller’s market to a more neutral one.

  • Stability in Detached and Row Homes: These segments continue to see moderate demand, while apartments are facing slower sales.

Overall, the Somerset real estate market is transitioning towards a balanced phase, with increasing inventory and steady price growth. Buyers and sellers should monitor inventory trends, as a further increase in supply could ease price appreciation in the coming months.

Read

Tuscany Real Estate Market Summary – January 2025

Market Overview

In January 2025, the Tuscany real estate market saw steady growth, with an 8.0% year-over-year (Y/Y) increase in the total residential benchmark price, reaching $717,000. Sales activity was also on the rise, with 16 total residential sales, marking a 14% Y/Y increase. New listings increased 18% Y/Y, reaching 20 new properties on the market. However, inventory saw a significant rise of 157% Y/Y, indicating a more balanced market.

The sales-to-new listings ratio stood at 0.80, suggesting a shift away from a strong seller’s market. The months of supply increased to 1.13, signaling a slight softening in competition among buyers compared to previous months.

Market Trends by Property Type

  • Detached Homes:

    • The benchmark price reached $802,700, an 11% Y/Y increase.

    • Sales in this segment remained strong, accounting for a significant share of transactions.

    • Inventory levels increased 27% Y/Y, indicating more options for buyers.

  • Semi-Detached Homes:

    • No sales were recorded for this segment in January 2025.

    • Inventory and months of supply remained at zero, likely due to low availability.

  • Row/Townhomes:

    • Sales increased 300% Y/Y, with 4 units sold.

    • The benchmark price reached $469,200, up 9% Y/Y.

    • Inventory remained stable.

  • Apartments:

    • Sales declined 50% Y/Y, with only 2 units sold.

    • The benchmark price was $420,700, up 5% Y/Y.

    • Inventory levels dropped 40% Y/Y, indicating demand remains relatively strong despite lower sales.

2025 Real Estate Outlook

  • Continued Price Growth: Home prices in Tuscany are expected to trend upward in 2025, albeit at a moderated pace compared to the sharp increases seen in previous years.

  • Increased Inventory: The rise in available listings and inventory levels suggests that buyers may have more choices in the coming months, potentially easing competition.

  • Balanced Market Conditions: With sales and new listings increasing, but at a more sustainable rate, the Tuscany market is moving towards a balanced environment.

  • Strong Demand for Detached and Row Homes: While apartment sales saw a dip, the demand for detached and row homes remains high, with steady price appreciation in these segments.

Overall, Tuscany's real estate market in early 2025 reflects a transition toward more stable conditions, with sustained demand for housing and gradual price increases across most property types.

Read

Dalhousie Real Estate Market Summary – January 2025

Market Trends

  • Detached Homes:

    • Benchmark Price: $735,600 (8% YoY increase)

    • Sales: 1 (No change from last year)

    • Inventory: 5 (67% increase YoY)

    • Months of Supply: 5.00 (Balanced market)

  • Semi-Detached Homes:

    • Benchmark Price: $478,300 (9% YoY increase)

    • No sales recorded

    • Inventory: 0, reflecting a continued supply constraint

  • Row/Townhouses:

    • Benchmark Price: $339,200 (5% YoY increase)

    • Sales: 1 (No change from last year)

    • Inventory: 3 (50% increase YoY)

  • Apartments:

    • Benchmark Price: $233,100 (3% YoY increase)

    • Sales: 4 (-20% YoY decrease)

    • Inventory: 7 (100% YoY increase)

    • Months of Supply: 1.75, showing sustained demand

  • Overall Residential Market:

    • Benchmark Price: $469,400 (2.8% YoY increase)

    • Total Sales: 6 (-25% YoY decline)

    • Inventory: 16 (6% YoY decrease)

    • Months of Supply: 2.67, indicating a balanced market


2025 Real Estate Outlook for Dalhousie

  • Continued Price Growth: Prices are expected to continue rising, though at a slower pace, driven by limited inventory and steady demand.

  • Supply Challenges: Semi-detached homes remain in low supply, potentially driving price increases in this segment.

  • Shifting Demand: Apartments and townhouses are seeing stronger demand, particularly among first-time buyers and investors.

  • Market Balance Expected: With increasing inventory and slower sales, the market is shifting from a seller’s market to a balanced market, which may create better buying opportunities in the second half of the year.

  • Economic & Interest Rate Impact: Interest rates and affordability concerns could moderate sales activity, particularly for higher-priced properties.

Dalhousie remains a desirable community due to its proximity to transit, shopping, and the University of Calgary. Buyers looking for affordability will likely continue targeting apartments and townhouses, while detached home sales may slow due to rising prices.

Read

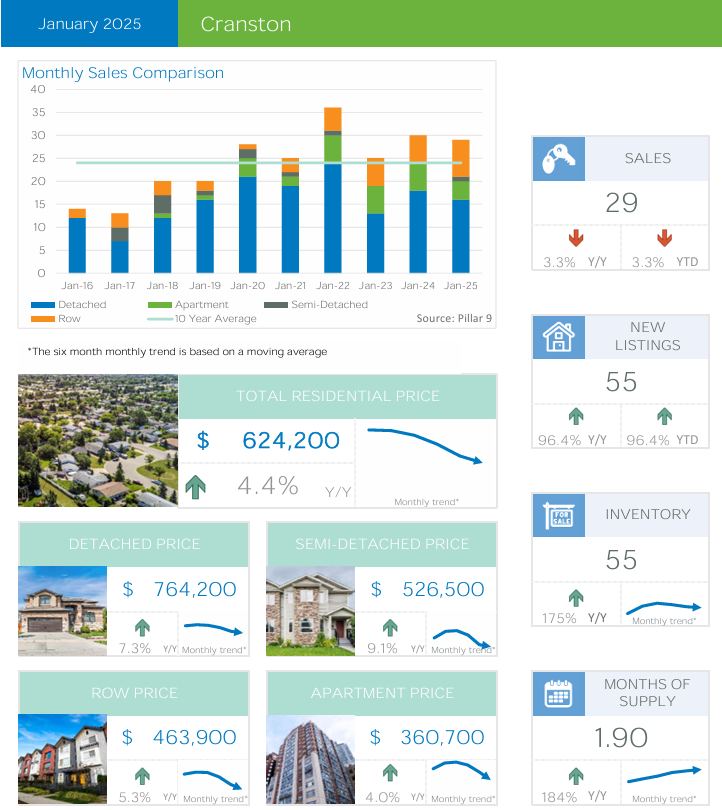
Cranston Real Estate Market Summary – January 2025

The Cranston real estate market saw a mixed performance in January 2025, with notable activity across different property types. Here’s a breakdown of key market trends:

Sales and Inventory

  • Total residential sales for January reached 29 units, reflecting a slight 3% decrease year-over-year.

  • Inventory levels increased by 96% compared to last year, with 55 active listings.

  • The months of supply increased to 1.90, suggesting a more balanced market compared to previous periods.

Home Prices

  • The benchmark price for total residential properties in Cranston rose to $624,200, up 4.4% year-over-year.

  • Detached homes saw a 7% price increase, reaching a benchmark of $764,200.

  • Semi-detached homes had a benchmark price of $526,500, marking a 9% year-over-year rise.

  • Row homes’ benchmark price increased by 5.3%, reaching $463,900.

  • Apartment-style properties recorded a 4% price increase, with a benchmark price of $360,700.

Market Activity & Demand

  • The sales-to-new-listings ratio stood at 53%, indicating that just over half of new listings were absorbed by buyers.

  • Detached homes saw 16 sales, a 11% drop from January 2024, with inventory rising 50%.

  • Row homes experienced 8 sales, increasing 33% year-over-year, with inventory up 133%.

  • Apartment sales fell by 33%, with only 4 units sold, but inventory increased significantly by 300%.

Days on Market

  • The average days on market for homes in Cranston was 31 days, slightly faster than previous months.

  • Homes continue to sell close to asking prices, with the sale-to-list price ratio at 99.4%, showing strong buyer demand.

1. Detached Homes

  • Sales: 16 units sold (↓ 11% from Jan 2024)

  • New Listings: 27 new listings (↑ 50% Y/Y)

  • Inventory: 27 active listings (↑ 50% Y/Y)

  • Benchmark Price: $764,200 (↑ 7% Y/Y)

  • Months of Supply: 1.69 months (↑ 153% Y/Y)

🔹 Market Insight: The detached home market remains strong, with prices increasing despite a drop in sales. The growing inventory and months of supply indicate a shift towards a more balanced market, but demand is still present.


2. Semi-Detached Homes

  • Sales: 1 unit sold (same as last year)

  • New Listings: 2 new listings (↑ 100% Y/Y)

  • Inventory: 2 active listings (↑ 100% Y/Y)

  • Benchmark Price: $526,500 (↑ 9% Y/Y)

  • Months of Supply: 1.00 months (unchanged Y/Y)

🔹 Market Insight: The semi-detached market saw minimal activity, with only one sale. However, prices rose significantly, suggesting demand for this property type remains stable despite limited sales volume.


3. Townhouses (Row Homes)

  • Sales: 8 units sold (↑ 33% Y/Y)

  • New Listings: 14 new listings (↑ 133% Y/Y)

  • Inventory: 13 active listings (↑ 133% Y/Y)

  • Benchmark Price: $463,900 (↑ 5.3% Y/Y)

  • Months of Supply: 1.63 months (↑ 117% Y/Y)

🔹 Market Insight: Townhouses experienced increased sales and rising prices, though inventory growth suggests buyers now have more choices. The market remains competitive but is showing signs of balance.


4. Apartments

  • Sales: 4 units sold (↓ 33% Y/Y)

  • New Listings: 12 new listings (↑ 300% Y/Y)

  • Inventory: 14 active listings (↑ 300% Y/Y)

  • Benchmark Price: $360,700 (↑ 4% Y/Y)

  • Months of Supply: 3.50 months (↑ 175% Y/Y)

🔹 Market Insight: The apartment market is cooling down, with a significant drop in sales and a surge in inventory. Prices continue to increase slightly, but buyers have more negotiating power due to rising supply levels.


Final Thoughts

  • Detached and semi-detached homes remain the strongest segments, with price growth and stable demand.

  • Townhouses are gaining traction, with rising sales and prices, though inventory growth is providing buyers with more options.

  • Apartments are seeing a shift towards a buyer’s market, with high inventory and slowing sales.

Read

Calgary Panorama Hills Real Estate Market Summary – January 2025

Market Trends by Property Type

  1. Detached Homes

    • Benchmark Price: $751,100 (+1% year-over-year)

    • Sales: 8 (-11% Y/Y)

    • Inventory: 11 (-31% Y/Y)

    • Months of Supply: 2.36

  2. Semi-Detached Homes

    • Benchmark Price: $544,600 (+3% Y/Y)

    • Sales: 1 (-67% Y/Y)

    • Inventory: 2 (-50% Y/Y)

    • Months of Supply: 1.00

  3. Row Homes

    • Benchmark Price: $404,200 (+1% Y/Y)

    • Sales: 3 (-50% Y/Y)

    • Inventory: 5 (+67% Y/Y)

    • Months of Supply: 2.67

  4. Apartments

    • Benchmark Price: $308,600 (+8% Y/Y)

    • Sales: 11 (+38% Y/Y)

    • Inventory: 20 (+300% Y/Y)

    • Months of Supply: 2.04

  5. Overall Market Performance

    • Total Residential Benchmark Price: $535,600 (-4.3% Y/Y)

    • Sales: 23 (-12% Y/Y)

    • New Listings: 38 (+36% Y/Y)

    • Inventory: 47 (+194% Y/Y)

    • Months of Supply: 2.04


Schools and Amenities in Panorama Hills

Panorama Hills is well-known for its family-friendly atmosphere, featuring several schools, including:

  • Elementary & Middle Schools: Panorama Hills School, Captain Nichola Goddard School

  • High Schools: John G. Diefenbaker High School (nearby)

Residents enjoy easy access to parks, pathways, and community facilities like the Panorama Hills Community Centre.

Shopping and Features

  • Shopping Centers: Residents benefit from multiple shopping destinations, including Country Hills Town Centre and Creekside Shopping Centre, providing access to grocery stores, restaurants, and retail outlets.

  • Recreation: The area features extensive green spaces, playgrounds, and the Vivo for Healthier Generations recreation center.


2025 Real Estate Outlook for Panorama Hills

  • Supply and Demand: While prices in most property segments have remained stable or increased, the rise in new listings and inventory could indicate a trend toward a more balanced market.

  • Affordability Concerns: The decline in the total residential benchmark price (-4.3%) suggests potential price corrections in 2025, benefiting buyers looking for opportunities.

  • Detached Homes and Townhouses: Still experiencing demand but with increasing supply, price growth may slow down.

  • Apartment Market: Inventory growth (+300%) could result in softer price appreciation and longer selling times.

Overall, Panorama Hills remains a desirable community with steady real estate activity. However, rising inventory and moderating prices suggest a shifting market where buyers may find better opportunities in 2025.

Read

Copperfield Real Estate Market Summary – January 2025

Copperfield remains a highly desirable neighborhood in Calgary's southeast, known for its affordability, family-friendly environment, and strong housing demand. The real estate market in January 2025 continued to show price growth despite shifting market conditions.

Market Highlights:

  • Total Residential Sales: 17 homes sold (+31% YoY).

  • Benchmark Price: $520,800 (+2.6% YoY).

  • Detached Homes: Benchmark price of $644,700 (+7% YoY).

  • Semi-Detached Homes: No sales recorded.

  • Row Homes: Benchmark price of $444,000 (+5% YoY).

  • Apartments: Benchmark price of $343,600 (+5% YoY).

  • New Listings: 26 homes listed, a 24% increase from last year.

  • Inventory: 25 active listings, up 56% from January 2024.

  • Months of Supply: 1.47, still favoring sellers but showing signs of balance.


Market Trends:

  • Sales activity rose by 31%, indicating continued buyer interest in Copperfield, particularly for detached and row homes.

  • Inventory levels have increased by 56%, giving buyers more choices compared to 2024.

  • Price growth continues across all property types, with detached homes seeing the biggest jump (+7%).

  • Months of supply at 1.47 suggests the market is still slightly in favor of sellers, though conditions are shifting toward balance.

  • New listings increased by 24%, which could slow down price growth if supply keeps rising in the coming months.

If the trend of increasing inventory continues, buyers may have more negotiating power later in 2025, but for now, Copperfield remains a competitive and growing market.


Community Features:

Shopping & Amenities

Copperfield offers convenient access to retail and essential services, with several shopping hubs nearby:

  • 130th Avenue SE Shopping District – Major retailers including Walmart, Home Depot, Superstore, and multiple restaurants.

  • McKenzie Towne Centre – Local shops, cafes, and grocery stores within minutes.

  • South Trail Crossing – A large commercial hub offering a mix of shopping, dining, and professional services.

Transportation & Connectivity

Copperfield provides excellent road and transit access, making it attractive for commuters:

  • Quick access to Deerfoot Trail & Stoney Trail, ensuring easy travel to downtown and other parts of Calgary.

  • Calgary Transit bus routes with connections to the Somerset-Bridlewood LRT station.

  • Future Green Line LRT expansion may further improve public transit options in the area.


Outlook for 2025

  • Price growth may slow if inventory levels continue to rise.

  • Demand for detached homes remains high, keeping this segment competitive.

  • Row homes and apartments continue to see steady price gains, making them appealing for first-time buyers.

  • Copperfield’s affordability, shopping, and transportation options will keep it a desirable choice for homebuyers.

Read

West Springs Real Estate Market Summary – January 2025

Market Trends by Property Type

  1. Detached Homes

    • Benchmark Price: $1,077,500 (+7% year-over-year)

    • Sales: 5 (-17% Y/Y)

    • Inventory: 7 (-22% Y/Y)

    • Months of Supply: 1.00 (down significantly, indicating strong demand)

  2. Semi-Detached Homes

    • Benchmark Price: $775,100 (+9% Y/Y)

    • Sales: 0 (No transactions recorded in January 2025)

    • Inventory: 0

  3. Row Homes

    • Benchmark Price: $501,100 (+10% Y/Y)

    • Sales: 4 (-33% Y/Y)

    • Inventory: 7 (+40% Y/Y)

    • Months of Supply: 4.11 (increased supply may lead to slower appreciation)

  4. Apartments

    • Benchmark Price: $460,900 (+8% Y/Y)

    • Sales: 0 (-100% Y/Y, no transactions in January 2025)

    • Inventory: 15 (+150% Y/Y)

    • Months of Supply: NA (No sales activity)

  5. Overall Market Performance

    • Total Residential Benchmark Price: $810,000 (+4.1% Y/Y)

    • Sales: 9 (-44% Y/Y)

    • New Listings: 29 (+38% Y/Y)

    • Inventory: 37 (+185% Y/Y)

    • Months of Supply: 4.11 (increasing inventory may signal a shift towards a more balanced market)


2025 Calgary Real Estate Outlook for West Springs

  • Price Growth: The overall market has continued to appreciate, with benchmark prices rising across all property types. However, slower sales and rising inventory levels may moderate price growth in the coming months.

  • Supply & Demand Shift: Detached and semi-detached homes remain in high demand, with low months of supply. Row homes and apartments, on the other hand, are seeing increased inventory, which could lead to longer selling times and potential price adjustments.

  • Market Balance: The rising months of supply (4.11) indicate that West Springs is shifting from a strong seller’s market toward a more balanced market. If inventory continues to rise, buyers may gain more negotiating power.

  • Investment Considerations: The high prices in detached and semi-detached segments make them premium investments, while row homes and apartments may present opportunities for buyers as inventory builds up.

Overall, while the West Springs real estate market remains strong, the increase in inventory suggests a potential cooling period in 2025, making it a more favorable environment for buyers in certain segments.

Read

Arbour Lake Real Estate Market Summary – January 2025

Market Trends by Property Type:

  • Total Residential Market:

    • Sales: 8 transactions (no year-over-year change).

    • New Listings: 14 (a 56% increase from January 2024).

    • Inventory: 16 active listings (167% increase year-over-year).

    • Benchmark Price: $595,100 (3.3% increase year-over-year).

    • Months of Supply: 2.00 months (suggesting balanced market conditions).

  • Detached Homes:

    • Sales: 5 homes sold (400% increase from January 2024).

    • New Listings: 7 homes (133% increase year-over-year).

    • Benchmark Price: $756,700 (8% annual increase).

    • Inventory: 5 active listings.

  • Semi-Detached Homes:

    • Sales: 1 home sold (67% decrease year-over-year).

    • New Listings: No new listings recorded.

    • Benchmark Price: $614,600 (8% increase from 2024).

    • Inventory: No active listings available.

  • Townhouses:

    • Sales: 1 transaction recorded.

    • New Listings: 2 properties listed.

    • Benchmark Price: $398,100 (8.9% annual increase).

    • Inventory: 4 active row home listings.

  • Apartments:

    • Sales: 1 apartment sold (75% decrease from January 2024).

    • New Listings: 5 units listed (0% year-over-year change).

    • Benchmark Price: $329,600 (3.3% annual increase).

    • Inventory: 7 available units.

    • Months of Supply: 7.00 months (indicating a buyer's market for apartments).

2025 Arbour Lake Real Estate Outlook:

  • Continued Demand for Affordable Housing:

    • Row homes and apartments will likely see strong interest due to their relatively lower price points.

    • Detached homes remain in high demand, reflected by their price appreciation.

  • Supply Challenges and Market Balance:

    • Inventory has risen, easing some market pressure, but demand for specific property types (such as semi-detached) may lead to price volatility.

    • If interest rates remain stable, steady price growth across all housing types is expected.

  • Seller’s Market for Detached Homes:

    • Strong demand and limited supply suggest continued price appreciation in the detached home sector.

  • Buyer’s Market for Apartments:

    • High months of supply indicate favorable conditions for buyers in the apartment segment.

  • New Construction and Development Impact:

    • Any upcoming developments in Arbour Lake could influence inventory levels and pricing trends throughout 2025.

Overall, Arbour Lake remains a sought-after community, with a dynamic market favoring different property types at varying levels. The overall trend suggests continued price appreciation but with potential opportunities for buyers in select segments like apartments.

Read

Royal Oak Real Estate Market Summary – January 2025

Market Trends:

  • Detached Homes

    • Sales: 4 transactions (+300% Y/Y, compared to 1 in Jan 2024)

    • Inventory: 8 units (+60% Y/Y)

    • Benchmark Price: $814,400, stable with 6% Y/Y growth

    • Months of Supply: 2.00, signaling a balanced market

  • Semi-Detached Homes

    • No sales reported in January (same as previous year)

    • Inventory: 2 units

    • Benchmark Price: $554,100 (N/A due to low sales activity)

  • Row Homes

    • Sales: 3 transactions (+200% Y/Y, compared to 1 in Jan 2024)

    • Inventory: 8 units (+700% Y/Y)

    • Benchmark Price: $474,000, reflecting 8.4% Y/Y growth

    • Months of Supply: 1.91, indicating a slight seller’s advantage

  • Apartments

    • Sales: 4 transactions (-43% Y/Y, compared to 7 in Jan 2024)

    • Inventory: 7 units (same as previous year)

    • Benchmark Price: $320,900, up 7.6% Y/Y

  • Overall Market Trends

    • Total Residential Sales: 11 transactions (+22% Y/Y)

    • New Listings: 25 listings (+79% Y/Y)

    • Total Residential Benchmark Price: $624,700 (+2.8% Y/Y)

    • Months of Supply: 1.91, showing a tighter market than last year

Comparison with Previous Months

MetricNovember 2024December 2024January 2025% Change (Jan vs. Dec)
Total Sales101011+10%
New Listings14825+212%
Inventory3321210%
Benchmark Price$620,000$611,900$624,700+2.1%
Months of Supply3.302.101.91-9%

Market Insights

  • Sales volume increased in January, showing a stronger start to the year compared to December.

  • New listings surged by 212%, bringing more inventory onto the market.

  • Detached and row home sales showed strong Y/Y growth, while apartment sales declined.

  • Prices remained stable with modest gains, reflecting continued demand.

2025 Real Estate Outlook for Royal Oak

  • Continued price growth is expected, driven by sustained demand in detached and row homes.

  • Tighter supply conditions may lead to increased competition, particularly in affordable property segments.

  • Interest rate fluctuations could impact affordability, influencing buyer activity in higher price ranges.

  • New listings will be key in shaping the market balance—if inventory remains limited, price growth could accelerate.

January 2025 started with strong sales momentum in the detached and row home sectors, while apartments experienced a slowdown. New listings increased significantly, offering more choices for buyers. The overall market remains in favor of sellers, but higher inventory levels could bring a more balanced market in the coming months.

Read

January Housing Market Update: Supply levels improve in January

By CREB®

Following three consecutive years of limited supply choice, inventory levels in January rose to 3,639 units. While the 70 per cent year-over-year gain is significant, inventory levels remain lower than the over 4,000 units we would typically see in January. 

Inventories rose across all property types, with some of the largest gains driven by apartment-style condominiums.

Overall sales in 2024 were just shy of last year’s levels, as gains for higher-priced homes offset pullbacks in the lower price ranges caused by supply challenges.

“Supply levels are expected to improve this year, contributing to more balanced conditions and slower price growth,” said Ann-Marie Lurie, Chief Economist at CREB®. “However, the adjustment in supply is not equal amongst all property types. Compared with sales, we continue to see persistently tight conditions for detached, semi-detached and row properties while apartment condominiums show signs of excess supply for higher priced units.”

Citywide, the months of supply reached 2.5 months in January, an improvement over the one month of supply reported last year, but it is still considered low for a winter month. The month of supply ranged from under two months for semi-detached properties to 3.5 months for apartment-style units.

Rising supply resulted from a boost in new listings compared to sales. New listings rose to 2,896 units in January, compared to 1,451 sales. Sales in January were down by 12 per cent compared to last year. However, even with a pullback in sales, levels remained nearly 30 per cent higher than levels typically recorded in January. 

The total residential benchmark price in January was $583,000, which is relatively stable compared to levels reported at the end of last year and nearly three per cent higher than last January. Price growth ranged across districts within the city as well as property types. 

Detached

Driven by gains from homes priced above $600,000, new listings reached 1,228 units in January, which is 29 per cent higher than last year. At the same time, sales activity slowed to 674 units, which brought levels in line with long-term trends. The improvement in new listings relative to sales did help support inventory gains. However, the 1,448 units in inventory are still nearly 27 per cent lower than levels we traditionally see in January, and the months of supply remained relatively low at just over two months. 

While conditions are not as tight as last year, there is some variation within the city districts as more balanced conditions are taking shape in the City Centre and North East districts. In January, the unadjusted benchmark price was $750,800, slightly higher than last month and seven per cent higher than last January. On a seasonally adjusted basis, prices have remained relatively stable since the second half of last year. 


Semi-Detached

Like other property types, gains in new listings relative to sales helped support some gains in inventory levels. While the semi-detached sector represents a relatively small share of activity in our market, sales in January did improve over last year, keeping the months of supply just below two months. Within the city, there is some significant variation, as the City Centre, North East, and West districts are all reporting near or above three months of supply, while all other districts have less than two months of supply. 

The unadjusted benchmark price in January was $673,600, slightly lower than last month but over eight per cent higher than levels reported last January. The districts with higher months of supply also reported some modest monthly price declines, offsetting stable to modest gains in the North, North West, South, South East, and East districts.


Row

January reported a boost in new listings compared to sales activity. This caused inventory levels to rise to 589 units, more than double the near-record low levels reported last January. The recent rise in new listings has helped bring inventories to levels that are more consistent with long-term trends. At the same time, the months of supply also improved, pushing above two months, a trend that started to play out over the second half of last year. 

Improving supply relative to sales has taken some of the pressure off home prices, but not consistently across the city. Citywide, the unadjusted benchmark price was $444.900, slightly lower than last month and nearly five per cent higher than last year. While prices are higher than last year across all districts, the largest monthly adjustment occurred in the North East district. 
 

Apartment Condominium

Sales in January slowed to 370 units over last year's record high for the month. At the same time, new listings reached 922 units, a new high for January. The gain in new listings relative to sales caused inventories to rise to 1,2,95 units. While sales have remained relatively strong, the gain in supply has pushed the months of supply up to 3.5 months. This is much higher than the levels seen over the past three years but nowhere near the nine months reported in January prior to the pandemic. 

Improved supply choice has weighed on prices over the past five months. In January, the unadjusted benchmark price was $331,400, slightly lower than last month but still five per cent higher than last year's levels. Like other property types, the level of adjustment varies across the city. The largest monthly declines occurred in the North, West and South districts.  

The Calgary real estate market in January 2025 experienced notable shifts, with increasing inventory and fluctuating sales across various property types. While new listings surged, sales saw a moderate decline, impacting supply levels and price trends.

Sales and Inventory Trends Total sales in January 2025 reached 1,451, marking a 12.01% decline compared to January 2024. The total sales volume also decreased by 6.50% to $877.9 million. Meanwhile, new listings rose significantly by 35.52%, reaching 2,896, leading to an inventory increase of 68.63%. Consequently, the months of supply climbed from 1.31 to 2.51, reflecting a 91.64% increase, signaling a shift toward a more balanced market.

Price Movements Despite increased inventory, prices demonstrated resilience. The benchmark price increased by 2.79%, reaching $583,000, while the median price saw a more substantial rise of 9.46% to $572,500. The average price also appreciated by 6.26% to $605,026.

Regional Breakdown

  1. City Centre:

    • Sales: 674 (-8.05%)

    • Benchmark Price: $750,800 (+7.03%)

    • Inventory: 1,448 (+44.94%)

    • Months of Supply: 2.15 (+57.63%)

  2. Northwest Calgary:

    • Sales: 132 (-55.30%)

    • Benchmark Price: $783,400 (+6.99%)

    • Months of Supply: 1.84 (+46.27%)

  3. Southeast Calgary:

    • Sales: 181 (-53.59%)

    • Benchmark Price: $718,700 (+6.95%)

    • Months of Supply: 1.87 (+23.32%)

  4. Northeast Calgary:

    • Sales: 174 (-47.70%)

    • Benchmark Price: $600,700 (+4.89%)

    • Months of Supply: 3.42 (+89.88%)

Property Type Analysis

  • Detached Homes: Sales fell 8.05% to 674 units, with the benchmark price increasing 7.03% to $750,800.

  • Apartments: Sales dropped 24.18%, but benchmark prices increased 5.31% to $331,400.

  • Semi-Detached Homes: Sales rose 22.14%, and prices surged 8.31% to $673,600.

  • Row Homes: Sales declined 16.84%, but prices increased 4.86% to $444,900.

Market Outlook The Calgary housing market in early 2025 shows a shift from the extreme seller’s conditions of previous years toward a more balanced market. Increased inventory levels give buyers more choices, while price growth remains steady due to ongoing demand. If new listings continue to outpace sales, price growth may stabilize further in the coming months. However, the strong price appreciation in certain segments, particularly semi-detached homes, suggests ongoing demand in specific property types.

Conclusion The Calgary real estate market in January 2025 presented a mixed performance. Rising inventory levels have led to a slight slowdown in sales activity, but price growth remains positive. Buyers have more options, and sellers may need to adjust expectations in response to a more balanced market. The overall trend indicates a cooling market compared to the rapid growth of previous years, setting the stage for a potentially more stable year ahead.

Read
Data is supplied by Pillar 9™ MLS® System. Pillar 9™ is the owner of the copyright in its MLS®System. Data is deemed reliable but is not guaranteed accurate by Pillar 9™.
The trademarks MLS®, Multiple Listing Service® and the associated logos are owned by The Canadian Real Estate Association (CREA) and identify the quality of services provided by real estate professionals who are members of CREA. Used under license.