RSS

Varsity Real Estate Market Summary – November 2024

In November 2024, the Varsity real estate market experienced strong sales growth, with 22 total residential sales, a 57% increase year-over-year. However, new listings declined by 60%, reducing available inventory. This led to a months of supply increase to 1.73, indicating a more balanced market than previous months.

The benchmark price for total residential properties stood at $561,600, reflecting a 1.0% annual increase.

Market Trends

  • Detached Homes: The benchmark price for detached homes was $913,000, with seven sales recorded, a 17% year-over-year increase. Inventory remained stable at eight listings, while months of supply remained tight.

  • Semi-Detached Homes: One semi-detached home sold in November, with no active inventory reported.

  • Row/Townhouses: The benchmark price for row homes reached $515,500, reflecting a 6.5% annual increase. Five sales were recorded, a 150% increase from the previous year, highlighting strong demand for this property type.

  • Apartments: Apartment sales grew by 50% year-over-year, with nine transactions recorded. The benchmark price for apartments reached $282,400, a 1.0% increase.

Community Features & Transportation

Varsity remains one of the most sought-after communities in Calgary due to its proximity to key amenities:

  • Schools: Varsity is home to top-ranked schools, including Marion Carson School, F.E. Osborne School, and Sir Winston Churchill High School, making it a preferred choice for families.

  • LRT Access & Transportation: The community is well-served by Brentwood LRT Station, providing convenient access to downtown Calgary and the University of Calgary. Public transit is widely available, and major roads such as Crowchild Trail and Shaganappi Trail offer easy commuting options.

  • Shopping & Recreation: Varsity is close to Market Mall, Northland Shopping Centre, and the University District, offering diverse shopping, dining, and entertainment options. Outdoor enthusiasts enjoy Bowmont Park and the Silver Springs Golf Course.

  • Health & Wellness: The Alberta Children's Hospital and Foothills Medical Centre are nearby, making Varsity a prime location for healthcare professionals and families.

Read

What happened in Calgary Real Estate Market in November?

Supply on the rise, but not across all price ranges

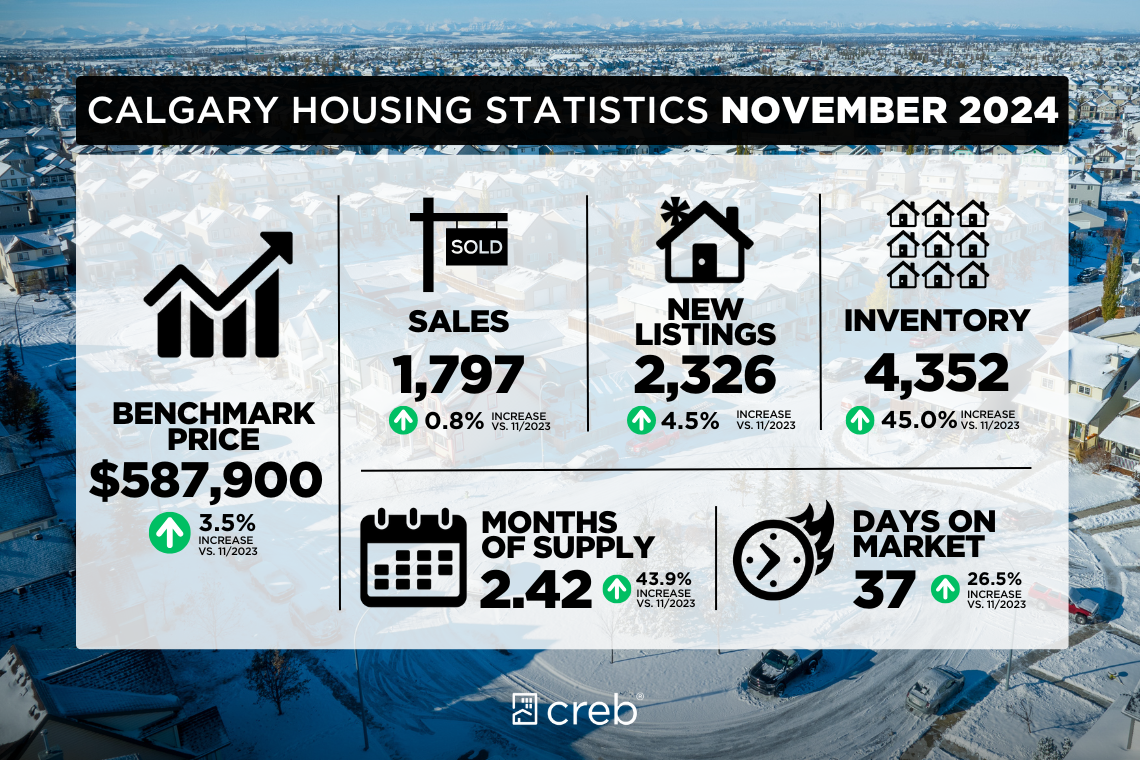
As we transition into winter, Calgary's housing market is following typical seasonal trends, with activity slowing compared to the fall. However, year-over-year demand remains relatively strong. In November, increased sales in detached, semi-detached, and row homes offset a decline in apartment condominium sales. The 1,797 sales for November mirrored last year’s levels and remained 20 per cent above long-term trends for the month.

The significant shift lies in supply. Inventory levels rose to 4,352 units in November, a notable increase from the 3,000 units reported last year. Despite the recent gains, inventory levels remain below long-term trends for the month.

“Housing supply has been a challenge over the past several years due to the sudden rise in population,” said Ann-Marie Lurie, Chief Economist at CREB®. “Rising new home construction has bolstered supply in rental, new home and resales ownership markets. However, supply improvements vary significantly by location, price range, and property type.”

The months of supply have increased to over two months, representing a shift away from the extremely low levels seen earlier this year and in the past three Novembers, which reported under two months of supply. While these more balanced conditions are promising for potential buyers, many market segments still favour sellers.

Improved supply options have tempered the pace of price growth. Year-over-year gains range from nearly seven per cent for row homes to nine per cent for apartment-style units. The total residential benchmark price reached $587,900, reflecting a year-over-year increase of just under four per cent. This slower growth reflects a shift toward more affordable row and apartment-style units. Seasonally adjusted prices have remained stable over the past four months despite unadjusted prices trending down in line with seasonal patterns.

Detached

Rising sales for homes above $600,000 offset the declines in the lower price ranges caused by limited supply choice. While inventory levels did improve, 85 per cent of the supply was priced above $600,000. Improving supply caused the months of supply to push above two months in November, with higher months of supply reported for homes priced above $700,000 and less than two months of supply for homes priced below that level. This variation within the market is likely to result in different price pressures.
 
The unadjusted detached benchmark price was $750,100, slightly lower than last month but over seven per cent higher than prices reported last year at this time. Year-over-year gains have ranged across the city, with slower growth reported in areas with the most competition from newer homes.  
 

Semi-Detached

There were 173 sales in November, an improvement over last year and contributing to the year-to-date growth of nearly five per cent. This was possible thanks to gains in new listings and higher supply levels. With two months of supply, conditions are not as tight as earlier in the year but still favour the seller, especially for properties priced below $700,000.

As of November, the unadjusted benchmark price was $675,100, nearly eight per cent higher than last November. The pace of price growth has eased over the past several months, primarily due to seasonal factors. Benchmark prices ranged from $926,800 in the City Centre district to $409,300 in the East district of the city.
 

Row

Row home sales improved in November compared to last year, contributing to nearly three per cent of year-to-date gains. Sales have remained exceptionally strong over the past three years as purchasers seek more affordable options. At the same time, new listings have also improved relative to sales, supporting year-over-year gains in inventory levels. Despite inventory improvements, conditions remained relatively tight with nearly two months of supply.

Following steep gains earlier in the year, the pace of price growth has eased. As of November, the unadjusted benchmark price was $454,200, nearly seven per cent higher than last year. Year-to-date average benchmark prices have improved by nearly 15 per cent. Row prices in the City Centre were the highest at $620,000, while the North East and East districts were the only areas to report benchmark prices below $400,000.
 

Apartment Condominium

Sales in November slowed over last year's record high. However, the 429 sales were still 47 per cent higher than long-term trends. New listings for apartment-style units have been on the rise. With 1,482 units available in November, more supply is available now than during the spring, and it is the only sector to see levels rise above long-term trends for the month.

The additional supply caused the months of supply to push above three months and is taking some of the pressure off home prices. As of November, the unadjusted benchmark price was $337,800, down over last month, but still nine per cent higher than last year. Supply has improved for units priced above $200,000, but most gains have been in the $300,000 to $500,000 range.  

Read

卡尔加里11月份市场报告-公寓成交量下滑!

供应量上升,但是没有覆盖所有价位的房屋

卡尔加里的住房市场在进入冬季时遵循了典型的季节性趋势,活动相比秋季有所放缓。然而,与去年同期相比,需求依然相对强劲。11月,独立屋、半独立屋和联排屋的销售增长弥补了公寓式共管房销售的下降。本月共售出1,797套房产,与去年同期持平,并且比长期趋势高出20%。

供应方面的变化尤为显著。11月的库存量增加至4,352套,较去年报告的3,000套有明显增长。尽管最近库存有所增加,但整体库存水平仍低于该月的长期趋势。

“过去几年,由于人口的突然增长,住房供应一直是一个挑战,”CREB®的首席经济学家Ann-Marie Lurie表示。“新房建设的增加提升了租赁、新建住房和转售市场的供应。然而,供应的改善在不同地区、价格区间和物业类型之间差异显著。”

住房供应月数已升至两个月以上,与今年早些时候及过去三个11月的不到两个月的极低水平形成对比。这种更为平衡的市场条件对潜在买家来说是个好消息,但许多市场细分仍然偏向卖方。

供应选择的改善减缓了价格增长的速度。与去年同期相比,联排屋的涨幅接近7%,而公寓式单位的涨幅达到9%。总体住宅市场基准价格达到$587,900,同比上涨不到4%。这一较慢的增长反映了市场转向更具可负担性的联排屋和公寓式单位。尽管未经调整的价格因季节性因素呈下降趋势,但经过季节性调整的价格在过去四个月内保持稳定。

独立屋
60万加元以上的住房销售增长,弥补了由于供应选择有限而导致低价位住房销售的下降。尽管库存水平有所改善,但85%的供应定价在$60万以上。供应的改善使得11月的供应月数超过两个月,其中$70万以上房屋的供应月数更高,而低于这一价格的房屋供应月数不足两个月。市场内的这种差异可能导致不同的价格压力。

未经调整的独立屋市场基准价格为$750,100,略低于上月,但比去年同期高出7%以上。全市各地的同比涨幅有所不同,在新房竞争最激烈的地区,增长较慢。

半独立屋
11月销售量达到173套,比去年有所增长,并推动年初至今的销售增长接近5%。这得益于新增房源和库存水平的提高。供应月数为两个月,虽然市场条件不像年初那么紧张,但仍然偏向卖方,尤其是对于价格低于$70万的房产。

截至11月,市场基准价格为$675,100,比去年11月高出近8%。由于季节性因素,价格增长的速度在过去几个月有所放缓。基准价格从市中心区域的$926,800到东部区域的409,300加元不等。

联排屋
11月联排屋销售量较去年有所增长,年初至今的销售增长接近3%。在过去三年中,随着购房者寻求更具可负担性的选择,销售一直保持强劲。同时,新增房源相较于销售也有所改善,支持了库存水平的同比增长。尽管库存有所改善,市场条件仍然相对紧张,供应月数接近两个月。

在年初的显著增长后,价格增长速度有所放缓。截至11月,市场基准价格为$454,200,比去年高出近7%。年初至今的平均基准价格增长了近15%。市中心区域的联排屋价格最高,为$620,000,而东北和东部区域是唯一基准价格低于$40万的地区。

共管公寓
11月的销售量较去年创纪录的高点有所放缓。然而,429套的销售量仍比长期趋势高出47%。公寓式单位的新房源持续增加。11月库存为1,482套,比春季时更高,这是唯一一个库存水平高于当月长期趋势的细分市场。

额外的供应使供应月数超过三个月,这在一定程度上缓解了房价的压力。截至11月,市场基准价格为$337,800,虽较上月有所下降,但仍比去年高出9%。价格超过20万的单位供应有所改善,但大部分增长集中在30万至50万区间。

卡尔加里周边城镇

Airdrie
库存量达到344套,Airdrie的供应正在回归到2020年前的活动水平。所有物业类型的供应水平均有所改善,其中独立屋和联排屋占供应量的84%。尽管销售量相对于长期趋势仍然强劲,但近期新增房源的增长有助于提升供应水平。

供应选择的改善在一定程度上缓解了房价压力。11月,总体住宅市场基准价格为$543,300,比去年11月高出4%。公寓式物业的同比变化最大,接近16%。

Cochrane
该镇11月新增房源数量创下历史新高。新增房源的增长伴随着销售激增,使得本月的销售量成为11月中报告的最高水平之一。销售的增长主要由独立屋市场推动。强劲的销售活动阻止了库存水平的大幅变化,库存仍比该月的长期趋势低18%。

过去几个月,价格增长的速度有所放缓,这在此时段并不罕见。截至11月,市场基准价格为$568,600,比去年同期高出近4%。尽管所有物业类型的价格均有所上涨,但公寓式房屋的价格涨幅最大。

Okotoks
与其他地区不同,Okotoks本月的新增房源下降至47套。同时,本月销售量为52套,阻止了该地区低库存状况的显著变化。自2020年底以来,Okotoks一直面临供应问题,使得供应月数在大部分时间内保持在两个月以下。

11月,市场基准价格为$624,000,比去年同期高出6%。所有物业类型的价格均有所提升,其中联排屋的涨幅最大。独立屋价格也在上涨,11月达到了$707,300。

具体报告,请看下面链接:

https://www.creb.com/Housing_Statistics/documents/11_2024_Calgary_Monthly_Stats_Package.pdf

更多卡尔加里房地产资讯,请查看链接

Jesus loves you!

Read

These are the Calgary neighbourhoods where homes sell the slowest

If you’re considering buying a new home in Calgary, new data has revealed which neighbourhoods had the slowest property sales.

The online real estate platform Wahi shared data with Daily Hive that rounded up the neighbourhoods in YYC where properties were selling the slowest in the third quarter of this year. This means you can weigh your options for longer when looking for a place to buy in these areas.

According to the data, the Calgary neighbourhoods that saw properties sell the slowest in the third quarter of 2024, excluding anything fewer than five sales, were as follows:

  • #4. Wildwood, with an average of 47 days on the market and a median sold price of $1,042,500

  • #4. Belmont, with an average of 47 days on the market and a median sold price of $529,947.50

  • #4. University Heights, with an average of 47 days on the market and a median sold price of $330,000

  • #4. Pine Creek, with an average of 47 days on the market and a median sold price of $684,950

  • #3. Christie Park, with an average of 48 days on the market and a median sold price of $1,144,500

  • #3. Downtown East Village, with an average of 48 days on the market and a median sold price of $327,500

  • #3. Cliff Bungalow, with an average of 48 days on the market and a median sold price of $220,000

  • #2. Eau Claire, with an average of 71 days on the market and a median sold price of $745,000

  • #1. Rosscarrock, with an average of 77 days on the market and a median sold price of $860,000

If these neighbourhoods don’t take your fancy, there are plenty of other areas in Calgary to continue your house search. But be quick if you’re interested in areas like Rosemont or Chinook Park, as those neighbourhoods are leading the list of where properties are selling the fastest.

Read

Top 5 Calgary neighbourhoods where homes sell the fastest

If you’re planning on purchasing a home in Calgary, new data has revealed which neighbourhoods in the city are seeing properties sell the fastest.

According to data provided to Daily Hive by Wahi, the online real estate platform rounded up the five neighbourhoods in Calgary that are seeing properties sit on the market for the shortest amount of time in the third quarter of this year.

The top five neighbourhoods that saw properties sell the fastest in the third quarter of 2024, excluding anything fewer than five sales, were as follows:

  • #5. Ranchlands, with an average of 16 days on the market and a median sold price of $560,000

  • #5. Millrise, with an average of 16 days on the market and a median sold price of $525,000

  • #5. Deer Run, with an average of 16 days on the market and a median sold price of $590,000

  • #5. Elboya, with an average of 16 days on the market and a median sold price of $1,117,500

  • #5. Queensland, with an average of 16 days on the market and a median sold price of $560,000

  • #5. Red Carpet, with an average of 16 days on the market and a median sold price of $265,000

  • #4. Vista Heights, with an average of 15 days on the market and a median sold price of $316,500

  • #4. Willow Park, with an average of 15 days on the market and a median sold price of $713,750

  • #3 Oakridge, with an average of 14 days on the market and a median sold price of $617,000

  • #2. Chinook Park, with an average of 12 days on the market and a median sold price of $790,100

  • #1 Rosemont, with an average of 11 days on the market and a median sold price of $939,500

(The list of where properties are selling the slowest)

Read

Calgary takes top spot for investors in PwC-Urban Land Institute report

Peter Mitham @ Western Investor

Calgary is Canada’s top market to watch when it comes to real estate in 2025, according to PricewaterhouseCoopers, with strong domestic and international interest.

“Canada has discovered Western Canada, and international markets have discovered Western Canada,” sources told the team preparing the 2025 Emerging Trends in Real Estate report, produced in partnership with the Urban Land Institute.

With a diversifying economy and a growing technology sector, including more than 300 clean-tech start-ups, Calgary is experiencing strong population growth that’s in turn driving demand for housing and services.

Office vacancies remain high, with downtown reporting a rate slightly below 30% according to CBRE Ltd., but Calgary is offering incentives to encourage the conversion of space to help address an oversupply of older B and C class space.

The recent sale 635 8th Avenue SW also signals renewed confidence among investors in office space in its own right.

Despite having some of the fastest-growing residential construction costs in Canada through the second quarter of this year, PwC noted that both rent and sale prices have kept pace with the increases. This is preserving margins and helping ensure ongoing investor interest.

These factors are also what sets Calgary apart from Vancouver, which placed second in the annual ranking of appeal to investors.

“Condo development in Vancouver is subdued due to financing challenges and high construction costs,” the report stated. “Several interviewees said land prices still haven’t come down enough to create a clear path to development since interest rates and construction costs remain high.”

The recent extension granted to Grosvenor on the Oakridge transit centre site illustrates the challenges. The ambitious makeover of the former bus depot has been delayed, with the city recently giving Grosvenor until 2033 to meet its commitments to the city for elements such as social housing and community amenities.

Cost is a big issue, a point made by those PwC interviewed for the trends report. The considerations even dog the rising number of sites being sold through court-ordered processes.

“We looked at over 50 land purchase deals over the last 12 months, and none made financial sense,” one source told PwC.

While some developers have launched new multi-family projects for sale as well as purpose-built rentals, market reception doesn’t mean it’s been easy to pull the trigger. Some have been in the planning stages for a while, such as Fraser Mills in Coquitlam. Presales have accelerated in recent months as lower interest rates drew in buyers, and Beedie Living broke ground on the first two towers in October.

In Vancouver, Prima Properties is set to launch Monogram, a 49-storey tower at Burrard and Davie, on a site whose low land costs make economic sense today. The site was purchased in 2005 for $13.4 million, which works out to $46 per buildable square foot as rezoned in 2021 (not including holding costs).

Others, such as a 141-unit multi-family rental development PC Urban and Fiera are building in Vancouver, broke ground in October having secured Canada Mortgage and Housing Corp. funding.

“It’s never been more difficult,” said Brent Sawchyn, founder and CEO of PC Urban. “We’re seeing a moderation in construction price but we’re still dealing with a 35% or 40% increase over the past few years.”

Throw in taxes, development cost charges (including Metro Vancouver’s plans to quadruple rates over the next three years) and other demands, and developments quickly become unviable.

Sawchyn notes a “recession of capital” has limited the financial resources of developers, which is where CMHC financing becomes key.

“It’s a huge, huge challenge to get a rental building under construction without CMHC financing,” he said.

However, CMHC has also changed its financing requirements over the last nine months, increasing affordable housing and energy efficiency requirements.

To address the challenges, PwC says Vancouver is seeing a trend of developers looking to partner with retail chains to occupy space in multiple properties to animate at-grade space.

Others are exploring joint ventures with long-term landowners to facilitate land acquisition and future development.

Read

Hamptons Real Estate Monthly Summary – October 2024

Market Overview

  • Sales: 7 transactions, a 22% decrease year-over-year (Y/Y).

  • New Listings: 11 properties, consistent with October 2023 levels.

  • Inventory: 19 active listings, up 27% from the previous year.

  • Months of Supply: 2.71 months, indicating a slightly tilted buyer’s market.

Pricing

  • Benchmark Price: $905,500, reflecting a 6.3% Y/Y increase.

  • Median Price: $900,000, up 11.1% Y/Y.

  • Average Price: $938,786, an 8.1% increase Y/Y.

Property Types

  • Detached Homes: Benchmark price at $977,600, a modest 2.2% Y/Y rise.

  • Row Houses: Benchmark price at $503,500, up 8.2% Y/Y.

  • Semi-Detached Homes & Apartments: No benchmark price recorded for October.

Market Trends

  • Gradual price increases signal sustained demand despite declining sales.

  • Inventory growth presents opportunities for buyers while moderating seller leverage.

  • The sales-to-new-listings ratio at 0.64 reflects steady but balanced market activity.

Summary

The Hamptons real estate market in October 2024 showed resilience with notable price growth across most segments despite a decline in sales volume. The increased inventory offers choices for buyers, making it a strategic time for negotiations in this premium community.

Read

Edgemont Real Estate Monthly Summary – October 2024

Market Overview: The Edgemont real estate market showcased notable activity in October 2024 with continued growth in both sales and listings:

  • Sales: A total of 12 residential properties were sold, marking a 50% increase year-over-year (Y/Y).

  • Inventory: Inventory rose by 48% Y/Y, reaching 34 units available.

  • New Listings: 23 new listings came to market, reflecting a 64% Y/Y rise.

Benchmark Prices by Property Type:

  • Detached Homes: $865,500 (+7.2% Y/Y).

  • Semi-Detached Homes: $491,900 (+18% Y/Y).

  • Row Homes: $524,100 (+4.6% Y/Y).

  • Apartments: $278,400 (+1.4% Y/Y).

General Residential Benchmark Price: $724,000, reflecting a 4.6% annual increase.

Key Metrics:

  • Months of Supply: 2.83 months, indicating a balanced to slightly seller-leaning market.

  • Sales-to-New-Listings (S/NL) Ratio: 0.52, suggesting moderate competition among buyers.

Trends and Insights:

  • Detached homes remain the most significant driver of sales, with an annual increase of 175% in activity.

  • The demand for apartments remains subdued compared to other property types, potentially signaling an opportunity for first-time buyers or investors.

  • Market balance is improving with rising inventory levels, providing more options for buyers.

Community Features: Edgemont continues to attract interest for its desirable attributes, including:

  • Recreational Amenities: Access to parks, trails, and community centers promoting outdoor and social activities.

  • Convenient Location: Proximity to key commercial areas, schools, and transport links.

  • Family-Friendly Environment: A strong sense of community with events and activities fostering neighborhood connections.

This blend of vibrant real estate dynamics and appealing community characteristics positions Edgemont as a thriving and sought-after market.

For more detailed market statistics or assistance, feel free to reach out!

Read

Panorama Hills Real Estate Monthly Summary – October 2024

Market Overview: In October 2024, Panorama Hills showcased a dynamic real estate market with significant activity across various metrics:

  • Sales: 28 properties sold, reflecting a 20% year-over-year (Y/Y) decrease.

  • New Listings: 50 new properties listed, marking a 35% Y/Y increase.

  • Inventory: 80 units available, a substantial 142% increase Y/Y.

Benchmark Prices by Property Type:

  • Detached Homes: $775,100 (+5.7% Y/Y).

  • Semi-Detached Homes: $562,200 (+5.9% Y/Y).

  • Row Homes: $412,500 (+14.0% Y/Y).

  • Apartments: $320,100 (+7.2% Y/Y).

Overall Residential Benchmark Price: $558,900, showing a modest 0.7% increase Y/Y.

Key Market Metrics:

  • Months of Supply: 2.86 months, leaning toward a balanced market.

  • Sales-to-New-Listings (S/NL) Ratio: 0.56, indicating a steady competition among buyers.

Market Insights:

  • The increase in inventory provides more opportunities for buyers to explore available options.

  • While sales have slowed slightly, price stability across all property types highlights the neighborhood’s desirability and market resilience.

Community Features: Panorama Hills remains a sought-after neighborhood due to its excellent amenities and family-oriented appeal:

  • Recreational Options: Access to green spaces, pathways, and community centers makes Panorama Hills ideal for outdoor enthusiasts.

  • Education and Convenience: The area features a variety of schools and is conveniently located near major transportation routes and shopping hubs.

  • Community Spirit: The neighborhood fosters a sense of belonging with regular events and initiatives aimed at enhancing resident experiences.

Panorama Hills continues to maintain its status as a preferred destination for families and individuals, combining strong market performance with an outstanding quality of life.

Read

Signal Hill Real Estate Monthly Summary – October 2024

In October 2024, Signal Hill’s real estate market experienced a steady performance with 20 total residential sales, reflecting a slight year-over-year (Y/Y) decline of 5%. Here’s a breakdown of key trends:

Sales and Inventory

  • Sales: Total residential sales stood at 20, with 8 detached homes and 10 apartment units dominating the activity. Semi-detached and row homes saw minimal activity, with semi-detached sales dropping to zero.

  • Inventory: Total inventory increased by 86% Y/Y to 39 units, contributing to a more balanced market.

  • New Listings: A total of 28 new listings were added, a 22% increase from October 2023.

Benchmark Prices

  • Overall: The total residential benchmark price for Signal Hill reached $664,300, up 5.5% Y/Y.

  • Detached Homes: The benchmark price for detached homes stood at $912,000, showing a 4.8% Y/Y increase.

  • Apartment Condominiums: Benchmark prices for apartments rose to $375,200, reflecting an 8.7% Y/Y growth.

  • Row Homes: The benchmark price for row homes was $458,600, up 9.7% Y/Y.

  • Semi-Detached Homes: No transactions occurred this month, limiting available price trend data.

Market Conditions

  • Months of Supply: The months of supply increased to 1.95, signaling a more balanced market compared to previous months with tighter conditions.

  • Sales-to-New-Listings (S/NL) Ratio: The S/NL ratio stood at 71%, indicating a moderate absorption rate.

  • Days on Market (DOM): Average DOM increased slightly to 22 days, aligning with seasonal trends.

Observations
Signal Hill’s market in October 2024 reflects stability with modest price gains across most segments and increased inventory supporting more balanced conditions. Detached homes and apartments remain the primary drivers, while row homes also show strong price growth.

Read

Supply levels improving for higher-priced homes

Calgary Real Estate Market Report - OCT 2024

Sales gains for homes priced above $600,000 offset declines at the lower end of the market, resulting in October sales that were similar to last year. The 2,174 sales in October increased over September and stood 24 per cent above long-term trends for the month. “Housing demand has stayed relatively strong in our market as we move into the fourth quarter, with October sales rising over last month,” said Ann-Marie Lurie, Chief Economist at CREB®. “However, activity would likely have been stronger if more supply choices existed for lower-priced homes. Supply levels in our market are improving relative to the ultra-low levels experienced last year, but much of the gains have been driven by higher-priced units for each property type. This results in conditions far more balanced in the upper end of the market versus the seller's market conditions in the lower to mid-price ranges of each property type.”

The gains in new listings relative to sales over the past six months have supported inventory gains in the city. As of October, 4,966 units were available, a significant improvement over the near-record low of 3,205 units reported last October. While inventories are starting to reach levels more consistent with long-term trends, the inventory composition has changed as nearly half of all the residential inventory is now priced above $600,000.

Adjustments in supply are helping move the market away from the tight market conditions experienced in the spring. However, conditions remain relatively tight, with 2.3 months of supply and a 67 per cent sales-to-new listings ratio, and the months of supply does vary significantly by price range and property type. For example, detached homes priced below $700,000 are reporting less than two months of supply, while homes priced over $1,000,000 are reporting over three months of supply. This is likely resulting in different price pressures depending on price range and property type.

Overall, the total residential benchmark price was $592,500 in October, over four per cent higher than last October and on a year-to-date basis, averaging over eight per cent higher than last year's levels. The unadjusted benchmark prices did ease slightly over last month due to seasonal factors, as seasonally adjusted prices remained relatively stable in October compared to September.

Please read the full report here.

Read

Calgary Real Estate Market Report - Auburn Bay October 2024

Overview

In October 2024, Auburn Bay in SE Calgary saw significant activity in its real estate market, reflecting both a strong demand and notable price increases across different property types. This report provides a detailed analysis of the residential market performance, including price trends, inventory levels, and sales statistics.

Market Snapshot

  • Average Home Price: $631,600.00

  • Median Home Price: $610,000

  • Price Range: $370,000 to $1,435,000

  • Average Days on Market: 23

  • Total Residential Sales: There were 31 total residential property sales in October, a 63% increase year-over-year (Y/Y).

  • New Listings: New listings increased by 34% Y/Y, totaling 47 for the month.

  • Inventory: The total residential inventory stood at 60, marking a 19% increase from October 2023.

  • Months of Supply: The overall months of supply reached 1.94, indicating a somewhat balanced market, though leaning towards a seller's market in specific property types due to low supply.

Property Type Analysis

  1. Detached Homes

    • Sales: 16 detached homes were sold, a remarkable 129% increase Y/Y.

    • Benchmark Price: $803,100, reflecting a 9% rise from the previous year.

    • New Listings: 23 new listings, marking a 44% increase Y/Y.

    • Months of Supply: 1.17, indicative of a competitive seller's market for detached properties.

  2. Semi-Detached Homes

    • Sales: Sales remained stable with 3 units sold, the same as October 2023.

    • Benchmark Price: $520,800, up by 10% Y/Y.

    • New Listings: 6 new listings, a 100% increase compared to the previous year.

    • Months of Supply: 0.61, showing strong demand and limited supply in this segment.

  3. Row Houses

    • Sales: Sales reached 9 units, an 80% increase Y/Y.

    • Benchmark Price: $465,300, up by 15% from October 2023.

    • New Listings: There were 10 new listings, marking a 150% increase Y/Y.

    • Months of Supply: 0.97, maintaining a tight supply level for row homes.

  4. Apartment Condos

    • Sales: Apartment sales decreased, with only 3 units sold (a 25% decline Y/Y).

    • Benchmark Price: $377,300, a significant 18% increase Y/Y, likely due to the scarcity of available inventory.

    • New Listings: New listings decreased to 8, a 33% drop from the previous year.

    • Months of Supply: High at 6.33, indicating a slower-paced buyer's market.

Price Trends and Affordability

The benchmark price for total residential properties in Auburn Bay averaged $631,600, marking a 6% increase from the prior year. Across all property types, detached homes continued to command the highest prices, while apartment condos remained the most affordable.

Price Distribution
  • A majority of detached home sales occurred in the $700,000–$999,999 price range.

  • Row houses and semi-detached homes typically fell in the $400,000–$599,999 range, appealing to middle-market buyers.

  • Apartment sales were concentrated below $400,000, catering to entry-level and investment buyers.

Auburn Bay’s real estate market in October 2024 reflected strong demand, particularly for detached, semi-detached, and row houses. Increased sales and rising prices across most segments indicate robust buyer interest. Apartment condos, however, faced softer demand, likely due to higher months of supply. The market dynamics suggest Auburn Bay remains attractive for both homeowners and investors, with low months of supply in several categories signaling continued demand-driven price support.

Contact us for a Free Home Evaluation.

For latest community market report, SIGNUP HERE.

Read
Data is supplied by Pillar 9™ MLS® System. Pillar 9™ is the owner of the copyright in its MLS®System. Data is deemed reliable but is not guaranteed accurate by Pillar 9™.
The trademarks MLS®, Multiple Listing Service® and the associated logos are owned by The Canadian Real Estate Association (CREA) and identify the quality of services provided by real estate professionals who are members of CREA. Used under license.